How removing video and simplifying the donation form affect conversion
Luther Seminary
Experiment Summary
Timeframe: 11/10/2021 - 11/25/2021
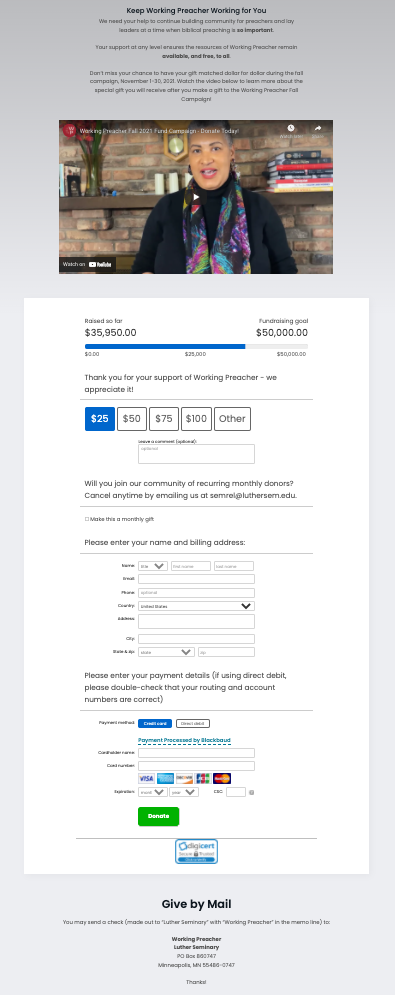
Luther Seminary was running their biannual Working Preacher donation campaign. The campaign had traditionally used the main WP donation page, with a special video and their standard donation page.
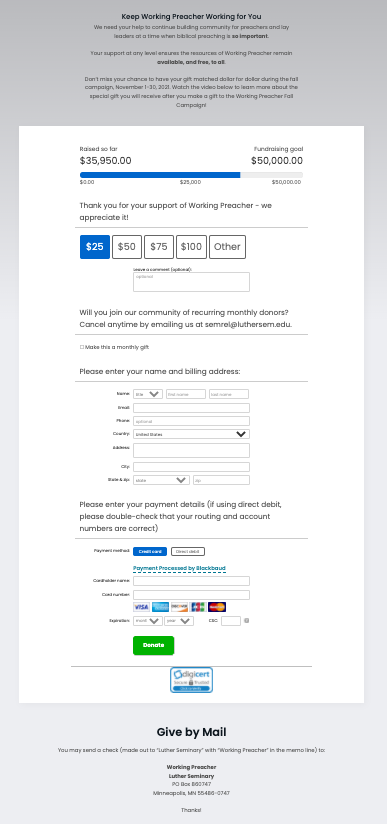
But based on previous research, the team wanted to test the impact of making two significant changes. First, they wanted to test the impact of removing the video, as video had shown to reduce conversion for other campaigns.
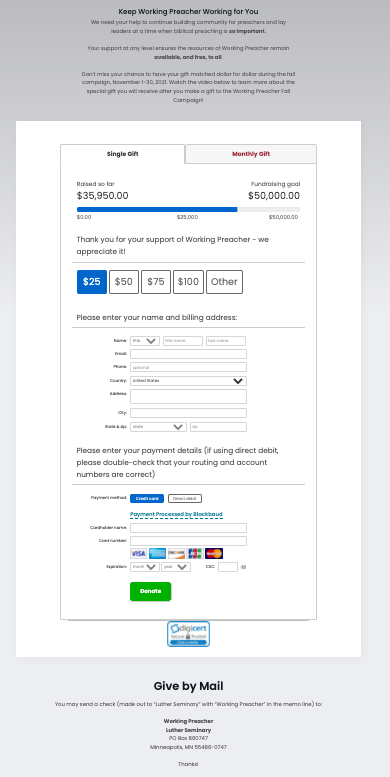
Secondly, they wanted to see how simplifying the donation process and reordering the steps would affect conversion. As it stood, the donation form had a thermometer, a gift array, and then asked for a comment. It made a recurring ask after the gift amount was chosen, which could lead to cognitive friction between the previously selected amount and the monthly ask. If someone selected a $100 amount, would they want to give that monthly? They wanted to test asking for the frequency of gift first, then following up with the amount. They also made the gift array decrease when monthly ask was selected to align with traditional monthly ask amounts. Finally, they removed the comments box, which presented unnecessary friction.
To understand the unique impact of these changes, they ran an A/B/C test where variant B only removed the video, and variant C removed the video and added the “tabbed” simplified form.
Research Question
We believe that removing the video and reordering and simplifying the donation process for website visitors will achieve an increase in conversion rate.
Design
Results
| Treatment Name | Conv. Rate | Relative Difference | Confidence | Average Gift | |
|---|---|---|---|---|---|
| C: | Control | 34.9% | $0.00 | ||
| T1: | Remove video | 40.0% | 14.5% | 44.8% | $0.00 |
| T2: | Remove video / tabbed form | 53.1% | 52.0% | 97.4% | $0.00 |
This experiment has a required sample size of 86 in order to be valid. Since the experiment had a total sample size of 209, and the level of confidence is above 95% the experiment results are valid.
Flux Metrics Affected
The Flux Metrics analyze the three primary metrics that affect revenue (traffic, conversion rate, and average gift). This experiment produced the following results:
0% increase in traffic
× 52.0% increase in conversion rate
× 0% increase in average gift
Key Learnings
Treatment C, with the removed video and the reordered, simplified donation form produced a 52% increase in conversion rate, with 97.3% significance. Digging deeper into the data, they found two interesting facts that showed how this was derived.
First, email traffic (which has a higher motivation due to reading a promotional message about the campaign) was largely unchanged. But direct traffic, the source of the most donations, was where the 52% lift was found.
Secondly, these changes did not affect desktop traffic at all, looking at all channels. But mobile traffic skyrocketed, with a 177.6% increase with a 99% level of confidence.
So in short, large gains in direct traffic (which has lower motivations) and mobile traffic (which has device-specific restrictions and where a video takes over the entire screen) were the sources of lift for this winning treatment.