How emotional language, clarity and authority affect ad clickthrough rate
Leadership Institute
Experiment Summary
Timeframe: 10/02/2017 - 11/09/2017
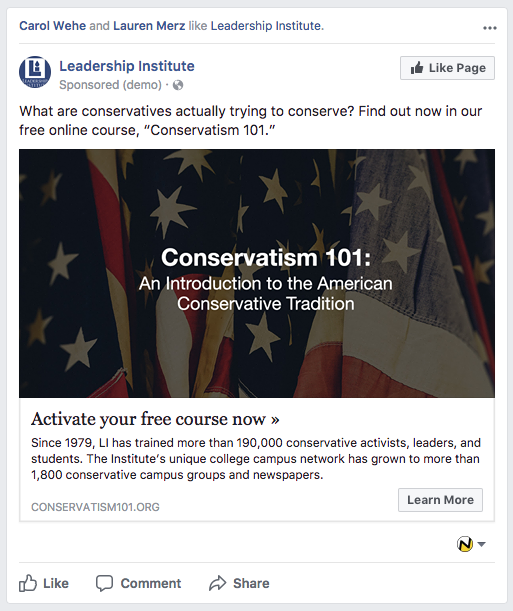
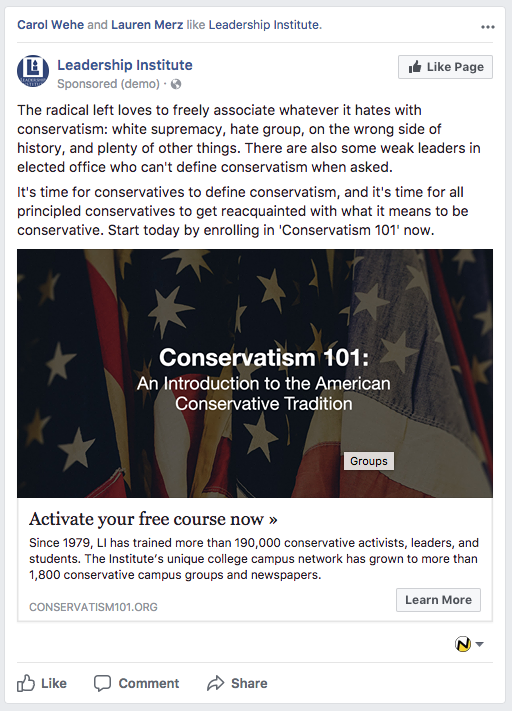
Leadership Institute recently re-launched a course about the history and principles of conservatism, called Conservatism 101. As they prepared to market this course through Facebook, they developed several different treatments for the advertisements. The first treatment posed a question: “What are conservatives actually trying to conserve?”, which implied that the course would answer that question. The second treatment introduced emotional language that outlined the threat to conservatism and made a call for conservatives to rediscover their principles. This treatment also included a call to action (CTA) in the top copy: “Start today by enrolling in Conservatism 101 now.” The third treatment took a similar tack with emotional language, but sought to align with the mindset of the reader by declaring the threat to be invalid. This treatment heightened the clarity and authority around the course offer, introducing a list of featured speakers, and introduced line breaks to better isolate the CTA: “Activate your free course today and discover—or rediscover—the principles and beauty of conservatism.” The final treatment used the same copy as the third treatment, but introduced a picture of Mark Levin with the CTA “Join Mark Levin in this new free course: Conservatism 101.”
Since Facebook is able to serve multiple ads simultaneously and gather data on each, they launched this A/B/C/D test to determine which ad produced the most clicks.
Research Question
How does emotional language, clarity and authority affect clickthrough rate?
Design


Results
| Treatment Name | Click Rate | Relative Difference | Confidence | |
|---|---|---|---|---|
| C: | Question-focused ad | 0.82% | ||
| T1: | Challenger copy | 0.89% | 9.6% | 61.3% |
| T2: | Separate interruptor line | 1.3% | 56.7% | 100.0% |
| T3: | Levin ad | 1.7% | 108.7% | 100.0% |
This experiment has a required sample size of 2,591 in order to be valid. Since the experiment had a total sample size of 112,921, and the level of confidence is above 95% the experiment results are valid.
Flux Metrics Affected
The Flux Metrics analyze the three primary metrics that affect revenue (traffic, conversion rate, and average gift). This experiment produced the following results:
56.7% increase in traffic
× 0% increase in conversion rate
× 0% increase in average gift
Key Learnings
After a few days, LI had enough data to determine a winner. Both the third and fourth treatment produced a clear, statistically significant increase in clickthrough rate over the other treatments. Treatment 3 produced a 56.7% increase over the baseline due to a combination of increased clarity and authority as well as visual clarity around the call-to-action. Treatment 4 produced the largest increase of all—a 108.7% increase over the baseline due to the copy adjustments from treatment three and the new image and embedded CTA, which reinforced the authority of the top copy.
In their next experiment, Leadership Institute isolated the top two performing ads to determine which one produced the most conversions on the following landing page.