How an animated progress bar impacted visits to the website
Marriage Today
Experiment Summary
Timeframe: 02/14/2018 - 12/28/2017
This was an end of year campaign and we wanted to see if adding an animated progress bar toward the year-end goal would catch more people’s attention and get them to click thru to the donation page. We wanted to try something a bit different because we had been sending so many emails to the file and were concerned they were beginning to tune out.
Research Question
Which email design would increase the click rate?
Design

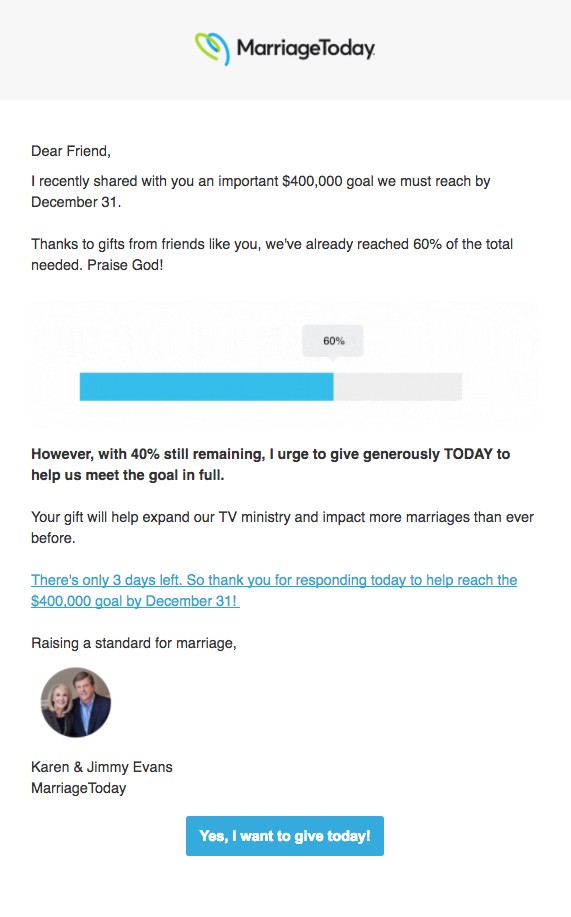
Results
| Treatment Name | Click Rate | Relative Difference | Confidence | |
|---|---|---|---|---|
| C: | Control | 0.14% | ||
| T1: | Animated Progress Bar | 0.26% | 90.3% | 100.0% |
This experiment has a required sample size of 10,043 in order to be valid. Since the experiment had a total sample size of 211,826, and the level of confidence is above 95% the experiment results are valid.
Flux Metrics Affected
The Flux Metrics analyze the three primary metrics that affect revenue (traffic, conversion rate, and average gift). This experiment produced the following results:
90.3% increase in traffic
× 0% increase in conversion rate
× 0% increase in average gift
Key Learnings
The animated progress bar did get more people to click thru to the donation page which was the goal. This is a great finding that we can apply to other campaigns. When the volume of emails increase this can be a tactic to grab people’s attention and get them clicking again. We did track the conversion rate on the donation pages, but the treatment did not increase the conversion rate with any level of confidence.