How visually realigning and streamlining a donation ask affects donations
CaringBridge
CaringBridge offers free personal, protected websites for people to easily share updates and receive support and encouragement from their community during a health journey. Every 7 minutes, a CaringBridge website is created for someone experiencing a health event.
Experiment Summary
Timeframe: 06/29/2018 - 07/15/2018
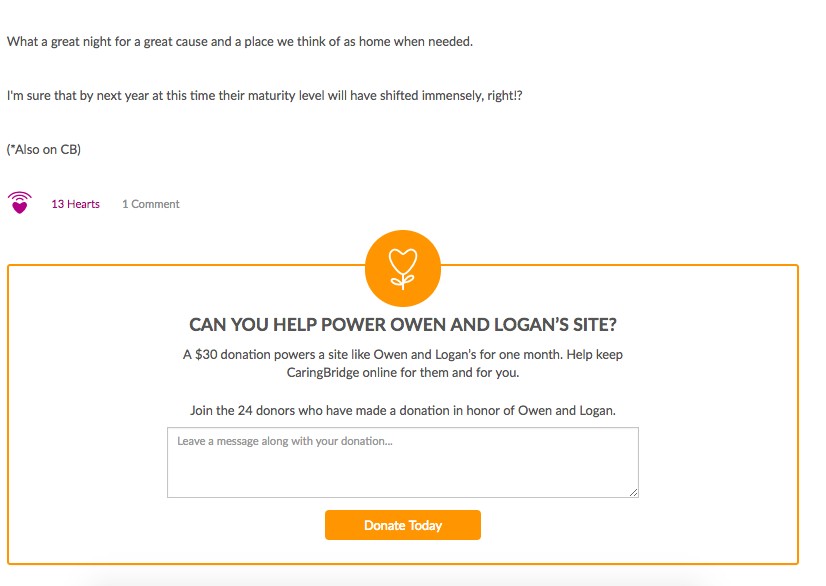
CaringBridge’s tribute widget had long been the primary source of donation revenue. Since a site redesign, the widget had been located in the center of the site, anchored in a box that was offset from the rest of the page by an orange box. The team wondered if this visually removed the tribute widget from the flow of the site, and caused readers who might give to miss it entirely.
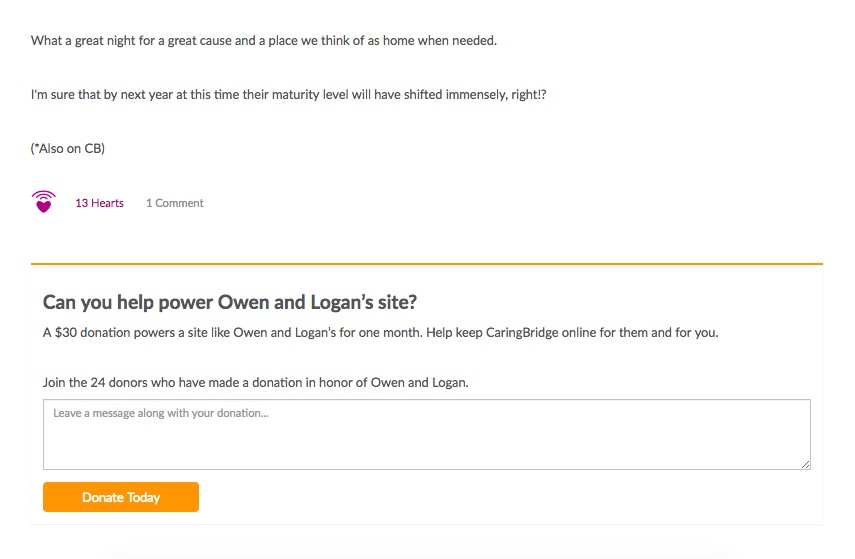
They designed a treatment to left-align the widget, move it much closer to the copy, and only offset it from the copy by a simple orange line. The copy remained entirely the same.
Research Question
Will visually realigning and streamlining a donation ask increase donations?
Design
Results
| Treatment Name | Conv. Rate | Relative Difference | Confidence | Average Gift | |
|---|---|---|---|---|---|
| C: | Control | 0.07% | $0.00 | ||
| T1: | Streamlined Widget | 0.07% | 9.3% | 95.4% | $0.00 |
This experiment has a required sample size of 1,365,250 in order to be valid. Since the experiment had a total sample size of 2,839,184, and the level of confidence is above 95% the experiment results are valid.
Flux Metrics Affected
The Flux Metrics analyze the three primary metrics that affect revenue (traffic, conversion rate, and average gift). This experiment produced the following results:
0% increase in traffic
× 9.3% increase in conversion rate
× 0% increase in average gift
Key Learnings
The treatment produced an overall 9.3% lift in donations to the site. The primary factor affecting this increase in donations was not an increase in motivation, but a decrease in friction that brought the value proposition closer to the reader—evidenced by a 55.4% increase in clicks to the donation page.
Traffic to these journal pages is mostly made up (70%) of mobile users—and the mobile version of this page produced a 33% increase in conversion, with 100% validity.
The increase in traffic to this test gives CaringBridge a better chance of validating donation page tests—and shows the potential impact of increasing downstream conversion, especially on mobile devices.