How ordering and value proposition affect donor conversion on a mobile device
CaringBridge
CaringBridge offers free personal, protected websites for people to easily share updates and receive support and encouragement from their community during a health journey. Every 7 minutes, a CaringBridge website is created for someone experiencing a health event.
Experiment Summary
Timeframe: 07/24/2018 - 08/09/2018
CaringBridge had a different site that was used for mobile donation traffic, built before the site was made responsive. Over time, these donation pages did not absorb optimizations made to the desktop versions, where the majority of conversions occurred.
They wanted to test the fully optimized version of the donation page in the mobile conversion experience, specifically from their JEN (Journal Email Notification) emails.
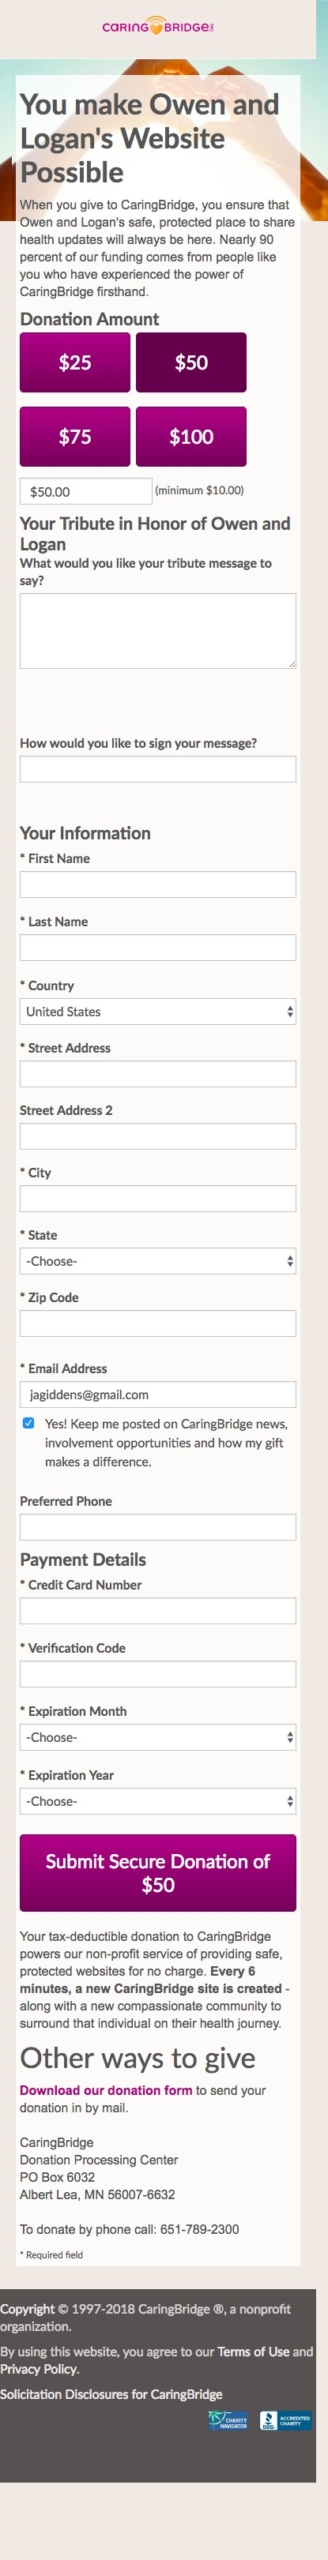
The JEN mobile donation pages had an image at the top which presented potential friction, a short paragraph of non-personalized value proposition copy, and the donation form. The donation form did not have numbered steps, which had proven to increase conversion on the desktop pages.
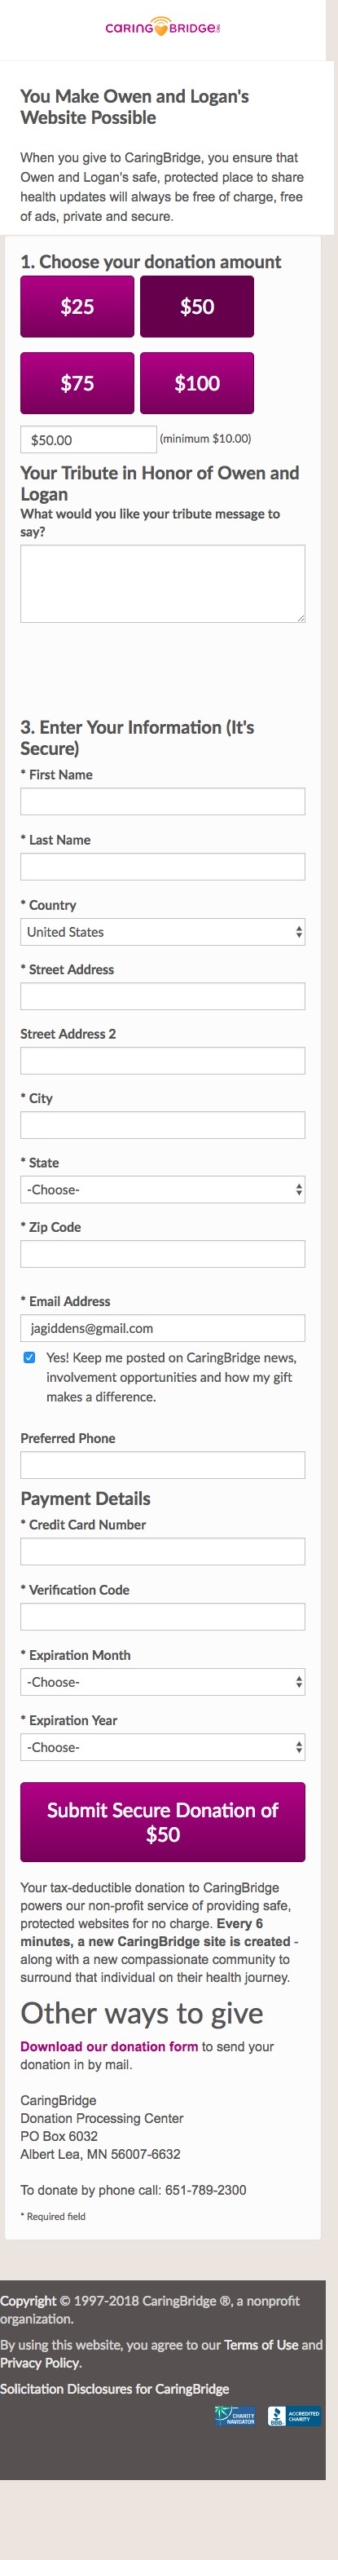
The team created two treatments—one with the form optimizations, and another with the form optimizations and the value proposition copy, so they could see the impact of each element.
Research Question
How ordering and value proposition affect donor conversion on a mobile device?
Design

Results
| Treatment Name | Conv. Rate | Relative Difference | Confidence | |
|---|---|---|---|---|
| C: | Control | 0.47% | ||
| T1: | With Previously Tested Optimizations | 0.70% | 50.1% | 90.2% |
| T2: | With Previously Tested Optimizations and Tribute copy | 0.78% | 68.0% | 96.8% |
This experiment has a required sample size of 7,422 in order to be valid. Since the experiment had a total sample size of 17,322, and the level of confidence is above 95% the experiment results are valid.
Flux Metrics Affected
The Flux Metrics analyze the three primary metrics that affect revenue (traffic, conversion rate, and average gift). This experiment produced the following results:
0% increase in traffic
× 68.0% increase in conversion rate
× 0% increase in average gift
Key Learnings
Both treatments produced a big lift to conversion—the first treatment (just with the form optimizations) produced a 50% lift to the control. The second treatment, with the added value proposition copy, produced an additional 36% relative lift for a total lift of 68% against the control.
These were not surprising, although there was some hesitation about how these optimizations would perform on mobile. But with this data, CaringBridge is one step closer to unifying the donation page experiences so that there is one experience across all devices. Currently, the mobile devices have different gift arrays, so that element will be tested next to determine the impact of the array on giving.