CaringBridge
How visually realigning and streamlining a donation ask affects donations
Experiment ID: #6340
CaringBridge
CaringBridge offers free personal, protected websites for people to easily share updates and receive support and encouragement from their community during a health journey. Every 7 minutes, a CaringBridge website is created for someone experiencing a health event.
Experiment Summary
Timeframe: 06/29/2018 - 07/15/2018
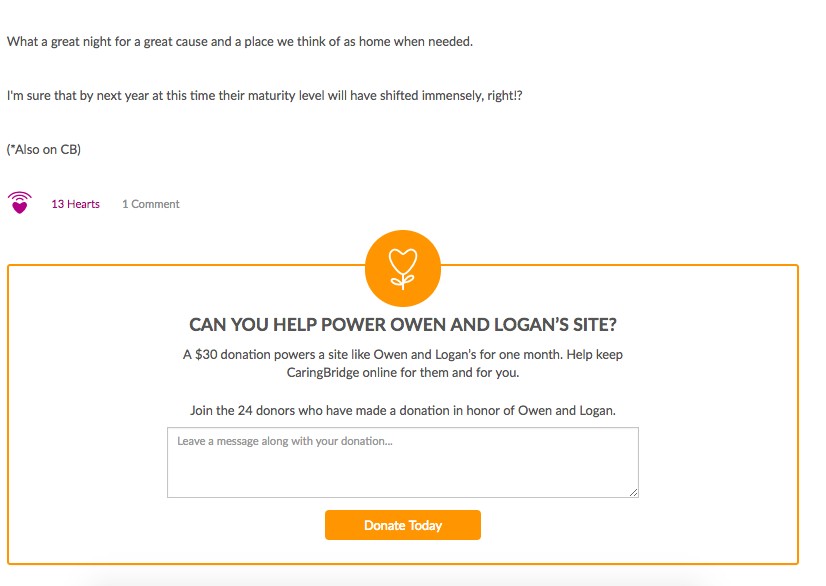
CaringBridge’s tribute widget had long been the primary source of donation revenue. Since a site redesign, the widget had been located in the center of the site, anchored in a box that was offset from the rest of the page by an orange box. The team wondered if this visually removed the tribute widget from the flow of the site, and caused readers who might give to miss it entirely.
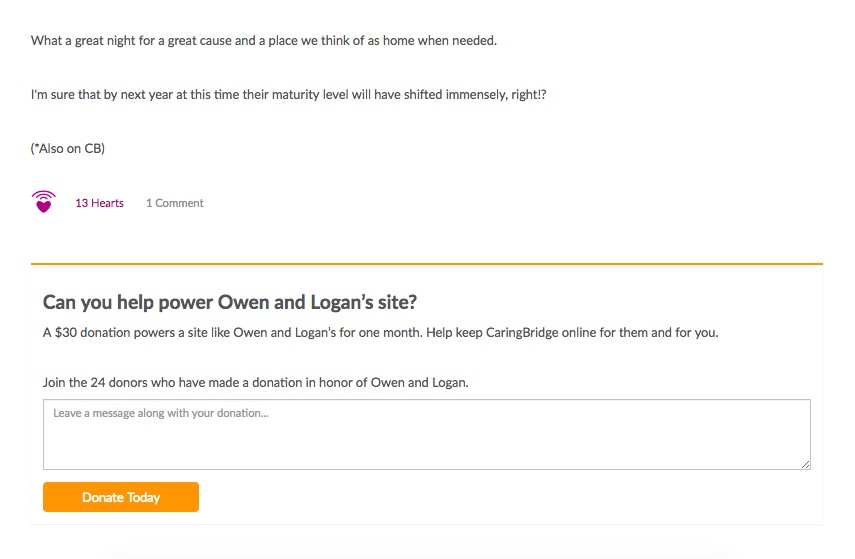
They designed a treatment to left-align the widget, move it much closer to the copy, and only offset it from the copy by a simple orange line. The copy remained entirely the same.
Research Question
Will visually realigning and streamlining a donation ask increase donations?
Design
C: Control

Array
(
[0] => Array
(
[ID] => 48171
[id] => 48171
[title] => Control.jpg
[filename] => Control-2395.jpg
[filesize] => 55820
[url] => https://nextafter-1a91a.kxcdn.com/wp-content/uploads/Control-2395.jpg
[link] => https://www.nextafter.com/experiments/how-visually-realigning-and-streamlining-a-donation-ask-affects-donations/attachment/control-jpg-2876/
[alt] =>
[author] => 0
[description] =>
[caption] =>
[name] => control-jpg-2876
[status] => inherit
[uploaded_to] => 15167
[date] => 2022-12-01 22:46:45
[modified] => 2022-12-01 22:46:45
[menu_order] => 0
[mime_type] => image/jpeg
[type] => image
[subtype] => jpeg
[icon] => https://nextafter-1a91a.kxcdn.com/wp-includes/images/media/default.png
[width] => 826
[height] => 586
[sizes] => Array
(
[thumbnail] => https://nextafter-1a91a.kxcdn.com/wp-content/uploads/Control-2395-150x150.jpg
[thumbnail-width] => 150
[thumbnail-height] => 150
[medium] => https://nextafter-1a91a.kxcdn.com/wp-content/uploads/Control-2395-300x213.jpg
[medium-width] => 300
[medium-height] => 213
[medium_large] => https://nextafter-1a91a.kxcdn.com/wp-content/uploads/Control-2395-768x545.jpg
[medium_large-width] => 640
[medium_large-height] => 454
[large] => https://nextafter-1a91a.kxcdn.com/wp-content/uploads/Control-2395.jpg
[large-width] => 640
[large-height] => 454
[1536x1536] => https://nextafter-1a91a.kxcdn.com/wp-content/uploads/Control-2395.jpg
[1536x1536-width] => 826
[1536x1536-height] => 586
[2048x2048] => https://nextafter-1a91a.kxcdn.com/wp-content/uploads/Control-2395.jpg
[2048x2048-width] => 826
[2048x2048-height] => 586
[ab-block-post-grid-landscape] => https://nextafter-1a91a.kxcdn.com/wp-content/uploads/Control-2395-600x400.jpg
[ab-block-post-grid-landscape-width] => 600
[ab-block-post-grid-landscape-height] => 400
[ab-block-post-grid-square] => https://nextafter-1a91a.kxcdn.com/wp-content/uploads/Control-2395-600x586.jpg
[ab-block-post-grid-square-width] => 600
[ab-block-post-grid-square-height] => 586
[tp-image-grid] => https://nextafter-1a91a.kxcdn.com/wp-content/uploads/Control-2395.jpg
[tp-image-grid-width] => 700
[tp-image-grid-height] => 497
[post-thumbnail] => https://nextafter-1a91a.kxcdn.com/wp-content/uploads/Control-2395-150x150.jpg
[post-thumbnail-width] => 150
[post-thumbnail-height] => 150
[admin] => https://nextafter-1a91a.kxcdn.com/wp-content/uploads/Control-2395-50x35.jpg
[admin-width] => 50
[admin-height] => 35
[full] => https://nextafter-1a91a.kxcdn.com/wp-content/uploads/Control-2395.jpg
[full-width] => 826
[full-height] => 586
[thumb_372] => https://nextafter-1a91a.kxcdn.com/wp-content/uploads/Control-2395-372x264.jpg
[thumb_372-width] => 372
[thumb_372-height] => 264
[single_post_thumbnail] => https://nextafter-1a91a.kxcdn.com/wp-content/uploads/Control-2395.jpg
[single_post_thumbnail-width] => 826
[single_post_thumbnail-height] => 586
[thumb_32_32] => https://nextafter-1a91a.kxcdn.com/wp-content/uploads/Control-2395-32x23.jpg
[thumb_32_32-width] => 32
[thumb_32_32-height] => 23
[thumb_48_48] => https://nextafter-1a91a.kxcdn.com/wp-content/uploads/Control-2395-48x34.jpg
[thumb_48_48-width] => 48
[thumb_48_48-height] => 34
[thumb_64_64] => https://nextafter-1a91a.kxcdn.com/wp-content/uploads/Control-2395-64x45.jpg
[thumb_64_64-width] => 64
[thumb_64_64-height] => 45
[thumb_128_128] => https://nextafter-1a91a.kxcdn.com/wp-content/uploads/Control-2395-128x91.jpg
[thumb_128_128-width] => 128
[thumb_128_128-height] => 91
[thumb_122_67] => https://nextafter-1a91a.kxcdn.com/wp-content/uploads/Control-2395-94x67.jpg
[thumb_122_67-width] => 94
[thumb_122_67-height] => 67
[thumb_153_153] => https://nextafter-1a91a.kxcdn.com/wp-content/uploads/Control-2395-153x109.jpg
[thumb_153_153-width] => 153
[thumb_153_153-height] => 109
[thumb_130_163] => https://nextafter-1a91a.kxcdn.com/wp-content/uploads/Control-2395-130x92.jpg
[thumb_130_163-width] => 130
[thumb_130_163-height] => 92
[thumb_232_177] => https://nextafter-1a91a.kxcdn.com/wp-content/uploads/Control-2395-232x165.jpg
[thumb_232_177-width] => 232
[thumb_232_177-height] => 165
[thumb_272_325] => https://nextafter-1a91a.kxcdn.com/wp-content/uploads/Control-2395-544x386.jpg
[thumb_272_325-width] => 544
[thumb_272_325-height] => 386
[thumb_271_346] => https://nextafter-1a91a.kxcdn.com/wp-content/uploads/Control-2395-271x192.jpg
[thumb_271_346-width] => 271
[thumb_271_346-height] => 192
[thumb_271_271] => https://nextafter-1a91a.kxcdn.com/wp-content/uploads/Control-2395-271x192.jpg
[thumb_271_271-width] => 271
[thumb_271_271-height] => 192
[thumb_272_172] => https://nextafter-1a91a.kxcdn.com/wp-content/uploads/Control-2395-242x172.jpg
[thumb_272_172-width] => 242
[thumb_272_172-height] => 172
[thumb_372_461] => https://nextafter-1a91a.kxcdn.com/wp-content/uploads/Control-2395-372x264.jpg
[thumb_372_461-width] => 372
[thumb_372_461-height] => 264
[thumb_372_500] => https://nextafter-1a91a.kxcdn.com/wp-content/uploads/Control-2395-372x264.jpg
[thumb_372_500-width] => 372
[thumb_372_500-height] => 264
[thumb_385_270] => https://nextafter-1a91a.kxcdn.com/wp-content/uploads/Control-2395-381x270.jpg
[thumb_385_270-width] => 381
[thumb_385_270-height] => 270
[thumb_416_241] => https://nextafter-1a91a.kxcdn.com/wp-content/uploads/Control-2395-340x241.jpg
[thumb_416_241-width] => 340
[thumb_416_241-height] => 241
[thumb_448_410] => https://nextafter-1a91a.kxcdn.com/wp-content/uploads/Control-2395-448x318.jpg
[thumb_448_410-width] => 448
[thumb_448_410-height] => 318
[thumb_448_410_retina] => https://nextafter-1a91a.kxcdn.com/wp-content/uploads/Control-2395.jpg
[thumb_448_410_retina-width] => 826
[thumb_448_410_retina-height] => 586
[thumb_574_382] => https://nextafter-1a91a.kxcdn.com/wp-content/uploads/Control-2395-538x382.jpg
[thumb_574_382-width] => 538
[thumb_574_382-height] => 382
[thumb_776_395] => https://nextafter-1a91a.kxcdn.com/wp-content/uploads/Control-2395-557x395.jpg
[thumb_776_395-width] => 557
[thumb_776_395-height] => 395
) ) [1] => Array
(
[ID] => 48172
[id] => 48172
[title] => Streamlined_Widget.jpg
[filename] => Streamlined_Widget-7.jpg
[filesize] => 54240
[url] => https://nextafter-1a91a.kxcdn.com/wp-content/uploads/Streamlined_Widget-7.jpg
[link] => https://www.nextafter.com/experiments/how-visually-realigning-and-streamlining-a-donation-ask-affects-donations/attachment/streamlined_widget-jpg-9/
[alt] =>
[author] => 0
[description] =>
[caption] =>
[name] => streamlined_widget-jpg-9
[status] => inherit
[uploaded_to] => 15167
[date] => 2022-12-01 22:47:00
[modified] => 2022-12-01 22:47:00
[menu_order] => 0
[mime_type] => image/jpeg
[type] => image
[subtype] => jpeg
[icon] => https://nextafter-1a91a.kxcdn.com/wp-includes/images/media/default.png
[width] => 855
[height] => 559
[sizes] => Array
(
[thumbnail] => https://nextafter-1a91a.kxcdn.com/wp-content/uploads/Streamlined_Widget-7-150x150.jpg
[thumbnail-width] => 150
[thumbnail-height] => 150
[medium] => https://nextafter-1a91a.kxcdn.com/wp-content/uploads/Streamlined_Widget-7-300x196.jpg
[medium-width] => 300
[medium-height] => 196
[medium_large] => https://nextafter-1a91a.kxcdn.com/wp-content/uploads/Streamlined_Widget-7-768x502.jpg
[medium_large-width] => 640
[medium_large-height] => 418
[large] => https://nextafter-1a91a.kxcdn.com/wp-content/uploads/Streamlined_Widget-7.jpg
[large-width] => 640
[large-height] => 418
[1536x1536] => https://nextafter-1a91a.kxcdn.com/wp-content/uploads/Streamlined_Widget-7.jpg
[1536x1536-width] => 855
[1536x1536-height] => 559
[2048x2048] => https://nextafter-1a91a.kxcdn.com/wp-content/uploads/Streamlined_Widget-7.jpg
[2048x2048-width] => 855
[2048x2048-height] => 559
[ab-block-post-grid-landscape] => https://nextafter-1a91a.kxcdn.com/wp-content/uploads/Streamlined_Widget-7-600x400.jpg
[ab-block-post-grid-landscape-width] => 600
[ab-block-post-grid-landscape-height] => 400
[ab-block-post-grid-square] => https://nextafter-1a91a.kxcdn.com/wp-content/uploads/Streamlined_Widget-7-600x559.jpg
[ab-block-post-grid-square-width] => 600
[ab-block-post-grid-square-height] => 559
[tp-image-grid] => https://nextafter-1a91a.kxcdn.com/wp-content/uploads/Streamlined_Widget-7.jpg
[tp-image-grid-width] => 700
[tp-image-grid-height] => 458
[post-thumbnail] => https://nextafter-1a91a.kxcdn.com/wp-content/uploads/Streamlined_Widget-7-150x150.jpg
[post-thumbnail-width] => 150
[post-thumbnail-height] => 150
[admin] => https://nextafter-1a91a.kxcdn.com/wp-content/uploads/Streamlined_Widget-7-50x33.jpg
[admin-width] => 50
[admin-height] => 33
[full] => https://nextafter-1a91a.kxcdn.com/wp-content/uploads/Streamlined_Widget-7.jpg
[full-width] => 855
[full-height] => 559
[thumb_372] => https://nextafter-1a91a.kxcdn.com/wp-content/uploads/Streamlined_Widget-7-372x243.jpg
[thumb_372-width] => 372
[thumb_372-height] => 243
[single_post_thumbnail] => https://nextafter-1a91a.kxcdn.com/wp-content/uploads/Streamlined_Widget-7.jpg
[single_post_thumbnail-width] => 855
[single_post_thumbnail-height] => 559
[thumb_32_32] => https://nextafter-1a91a.kxcdn.com/wp-content/uploads/Streamlined_Widget-7-32x21.jpg
[thumb_32_32-width] => 32
[thumb_32_32-height] => 21
[thumb_48_48] => https://nextafter-1a91a.kxcdn.com/wp-content/uploads/Streamlined_Widget-7-48x31.jpg
[thumb_48_48-width] => 48
[thumb_48_48-height] => 31
[thumb_64_64] => https://nextafter-1a91a.kxcdn.com/wp-content/uploads/Streamlined_Widget-7-64x42.jpg
[thumb_64_64-width] => 64
[thumb_64_64-height] => 42
[thumb_128_128] => https://nextafter-1a91a.kxcdn.com/wp-content/uploads/Streamlined_Widget-7-128x84.jpg
[thumb_128_128-width] => 128
[thumb_128_128-height] => 84
[thumb_122_67] => https://nextafter-1a91a.kxcdn.com/wp-content/uploads/Streamlined_Widget-7-102x67.jpg
[thumb_122_67-width] => 102
[thumb_122_67-height] => 67
[thumb_153_153] => https://nextafter-1a91a.kxcdn.com/wp-content/uploads/Streamlined_Widget-7-153x100.jpg
[thumb_153_153-width] => 153
[thumb_153_153-height] => 100
[thumb_130_163] => https://nextafter-1a91a.kxcdn.com/wp-content/uploads/Streamlined_Widget-7-130x85.jpg
[thumb_130_163-width] => 130
[thumb_130_163-height] => 85
[thumb_232_177] => https://nextafter-1a91a.kxcdn.com/wp-content/uploads/Streamlined_Widget-7-232x152.jpg
[thumb_232_177-width] => 232
[thumb_232_177-height] => 152
[thumb_272_325] => https://nextafter-1a91a.kxcdn.com/wp-content/uploads/Streamlined_Widget-7-544x356.jpg
[thumb_272_325-width] => 544
[thumb_272_325-height] => 356
[thumb_271_346] => https://nextafter-1a91a.kxcdn.com/wp-content/uploads/Streamlined_Widget-7-271x177.jpg
[thumb_271_346-width] => 271
[thumb_271_346-height] => 177
[thumb_271_271] => https://nextafter-1a91a.kxcdn.com/wp-content/uploads/Streamlined_Widget-7-271x177.jpg
[thumb_271_271-width] => 271
[thumb_271_271-height] => 177
[thumb_272_172] => https://nextafter-1a91a.kxcdn.com/wp-content/uploads/Streamlined_Widget-7-263x172.jpg
[thumb_272_172-width] => 263
[thumb_272_172-height] => 172
[thumb_372_461] => https://nextafter-1a91a.kxcdn.com/wp-content/uploads/Streamlined_Widget-7-372x243.jpg
[thumb_372_461-width] => 372
[thumb_372_461-height] => 243
[thumb_372_500] => https://nextafter-1a91a.kxcdn.com/wp-content/uploads/Streamlined_Widget-7-372x243.jpg
[thumb_372_500-width] => 372
[thumb_372_500-height] => 243
[thumb_385_270] => https://nextafter-1a91a.kxcdn.com/wp-content/uploads/Streamlined_Widget-7-385x252.jpg
[thumb_385_270-width] => 385
[thumb_385_270-height] => 252
[thumb_416_241] => https://nextafter-1a91a.kxcdn.com/wp-content/uploads/Streamlined_Widget-7-369x241.jpg
[thumb_416_241-width] => 369
[thumb_416_241-height] => 241
[thumb_448_410] => https://nextafter-1a91a.kxcdn.com/wp-content/uploads/Streamlined_Widget-7-448x293.jpg
[thumb_448_410-width] => 448
[thumb_448_410-height] => 293
[thumb_448_410_retina] => https://nextafter-1a91a.kxcdn.com/wp-content/uploads/Streamlined_Widget-7.jpg
[thumb_448_410_retina-width] => 855
[thumb_448_410_retina-height] => 559
[thumb_574_382] => https://nextafter-1a91a.kxcdn.com/wp-content/uploads/Streamlined_Widget-7-574x375.jpg
[thumb_574_382-width] => 574
[thumb_574_382-height] => 375
[thumb_776_395] => https://nextafter-1a91a.kxcdn.com/wp-content/uploads/Streamlined_Widget-7-604x395.jpg
[thumb_776_395-width] => 604
[thumb_776_395-height] => 395
) ) )
T1: Streamlined Widget

Array
(
[0] => Array
(
[ID] => 48171
[id] => 48171
[title] => Control.jpg
[filename] => Control-2395.jpg
[filesize] => 55820
[url] => https://nextafter-1a91a.kxcdn.com/wp-content/uploads/Control-2395.jpg
[link] => https://www.nextafter.com/experiments/how-visually-realigning-and-streamlining-a-donation-ask-affects-donations/attachment/control-jpg-2876/
[alt] =>
[author] => 0
[description] =>
[caption] =>
[name] => control-jpg-2876
[status] => inherit
[uploaded_to] => 15167
[date] => 2022-12-01 22:46:45
[modified] => 2022-12-01 22:46:45
[menu_order] => 0
[mime_type] => image/jpeg
[type] => image
[subtype] => jpeg
[icon] => https://nextafter-1a91a.kxcdn.com/wp-includes/images/media/default.png
[width] => 826
[height] => 586
[sizes] => Array
(
[thumbnail] => https://nextafter-1a91a.kxcdn.com/wp-content/uploads/Control-2395-150x150.jpg
[thumbnail-width] => 150
[thumbnail-height] => 150
[medium] => https://nextafter-1a91a.kxcdn.com/wp-content/uploads/Control-2395-300x213.jpg
[medium-width] => 300
[medium-height] => 213
[medium_large] => https://nextafter-1a91a.kxcdn.com/wp-content/uploads/Control-2395-768x545.jpg
[medium_large-width] => 640
[medium_large-height] => 454
[large] => https://nextafter-1a91a.kxcdn.com/wp-content/uploads/Control-2395.jpg
[large-width] => 640
[large-height] => 454
[1536x1536] => https://nextafter-1a91a.kxcdn.com/wp-content/uploads/Control-2395.jpg
[1536x1536-width] => 826
[1536x1536-height] => 586
[2048x2048] => https://nextafter-1a91a.kxcdn.com/wp-content/uploads/Control-2395.jpg
[2048x2048-width] => 826
[2048x2048-height] => 586
[ab-block-post-grid-landscape] => https://nextafter-1a91a.kxcdn.com/wp-content/uploads/Control-2395-600x400.jpg
[ab-block-post-grid-landscape-width] => 600
[ab-block-post-grid-landscape-height] => 400
[ab-block-post-grid-square] => https://nextafter-1a91a.kxcdn.com/wp-content/uploads/Control-2395-600x586.jpg
[ab-block-post-grid-square-width] => 600
[ab-block-post-grid-square-height] => 586
[tp-image-grid] => https://nextafter-1a91a.kxcdn.com/wp-content/uploads/Control-2395.jpg
[tp-image-grid-width] => 700
[tp-image-grid-height] => 497
[post-thumbnail] => https://nextafter-1a91a.kxcdn.com/wp-content/uploads/Control-2395-150x150.jpg
[post-thumbnail-width] => 150
[post-thumbnail-height] => 150
[admin] => https://nextafter-1a91a.kxcdn.com/wp-content/uploads/Control-2395-50x35.jpg
[admin-width] => 50
[admin-height] => 35
[full] => https://nextafter-1a91a.kxcdn.com/wp-content/uploads/Control-2395.jpg
[full-width] => 826
[full-height] => 586
[thumb_372] => https://nextafter-1a91a.kxcdn.com/wp-content/uploads/Control-2395-372x264.jpg
[thumb_372-width] => 372
[thumb_372-height] => 264
[single_post_thumbnail] => https://nextafter-1a91a.kxcdn.com/wp-content/uploads/Control-2395.jpg
[single_post_thumbnail-width] => 826
[single_post_thumbnail-height] => 586
[thumb_32_32] => https://nextafter-1a91a.kxcdn.com/wp-content/uploads/Control-2395-32x23.jpg
[thumb_32_32-width] => 32
[thumb_32_32-height] => 23
[thumb_48_48] => https://nextafter-1a91a.kxcdn.com/wp-content/uploads/Control-2395-48x34.jpg
[thumb_48_48-width] => 48
[thumb_48_48-height] => 34
[thumb_64_64] => https://nextafter-1a91a.kxcdn.com/wp-content/uploads/Control-2395-64x45.jpg
[thumb_64_64-width] => 64
[thumb_64_64-height] => 45
[thumb_128_128] => https://nextafter-1a91a.kxcdn.com/wp-content/uploads/Control-2395-128x91.jpg
[thumb_128_128-width] => 128
[thumb_128_128-height] => 91
[thumb_122_67] => https://nextafter-1a91a.kxcdn.com/wp-content/uploads/Control-2395-94x67.jpg
[thumb_122_67-width] => 94
[thumb_122_67-height] => 67
[thumb_153_153] => https://nextafter-1a91a.kxcdn.com/wp-content/uploads/Control-2395-153x109.jpg
[thumb_153_153-width] => 153
[thumb_153_153-height] => 109
[thumb_130_163] => https://nextafter-1a91a.kxcdn.com/wp-content/uploads/Control-2395-130x92.jpg
[thumb_130_163-width] => 130
[thumb_130_163-height] => 92
[thumb_232_177] => https://nextafter-1a91a.kxcdn.com/wp-content/uploads/Control-2395-232x165.jpg
[thumb_232_177-width] => 232
[thumb_232_177-height] => 165
[thumb_272_325] => https://nextafter-1a91a.kxcdn.com/wp-content/uploads/Control-2395-544x386.jpg
[thumb_272_325-width] => 544
[thumb_272_325-height] => 386
[thumb_271_346] => https://nextafter-1a91a.kxcdn.com/wp-content/uploads/Control-2395-271x192.jpg
[thumb_271_346-width] => 271
[thumb_271_346-height] => 192
[thumb_271_271] => https://nextafter-1a91a.kxcdn.com/wp-content/uploads/Control-2395-271x192.jpg
[thumb_271_271-width] => 271
[thumb_271_271-height] => 192
[thumb_272_172] => https://nextafter-1a91a.kxcdn.com/wp-content/uploads/Control-2395-242x172.jpg
[thumb_272_172-width] => 242
[thumb_272_172-height] => 172
[thumb_372_461] => https://nextafter-1a91a.kxcdn.com/wp-content/uploads/Control-2395-372x264.jpg
[thumb_372_461-width] => 372
[thumb_372_461-height] => 264
[thumb_372_500] => https://nextafter-1a91a.kxcdn.com/wp-content/uploads/Control-2395-372x264.jpg
[thumb_372_500-width] => 372
[thumb_372_500-height] => 264
[thumb_385_270] => https://nextafter-1a91a.kxcdn.com/wp-content/uploads/Control-2395-381x270.jpg
[thumb_385_270-width] => 381
[thumb_385_270-height] => 270
[thumb_416_241] => https://nextafter-1a91a.kxcdn.com/wp-content/uploads/Control-2395-340x241.jpg
[thumb_416_241-width] => 340
[thumb_416_241-height] => 241
[thumb_448_410] => https://nextafter-1a91a.kxcdn.com/wp-content/uploads/Control-2395-448x318.jpg
[thumb_448_410-width] => 448
[thumb_448_410-height] => 318
[thumb_448_410_retina] => https://nextafter-1a91a.kxcdn.com/wp-content/uploads/Control-2395.jpg
[thumb_448_410_retina-width] => 826
[thumb_448_410_retina-height] => 586
[thumb_574_382] => https://nextafter-1a91a.kxcdn.com/wp-content/uploads/Control-2395-538x382.jpg
[thumb_574_382-width] => 538
[thumb_574_382-height] => 382
[thumb_776_395] => https://nextafter-1a91a.kxcdn.com/wp-content/uploads/Control-2395-557x395.jpg
[thumb_776_395-width] => 557
[thumb_776_395-height] => 395
) ) [1] => Array
(
[ID] => 48172
[id] => 48172
[title] => Streamlined_Widget.jpg
[filename] => Streamlined_Widget-7.jpg
[filesize] => 54240
[url] => https://nextafter-1a91a.kxcdn.com/wp-content/uploads/Streamlined_Widget-7.jpg
[link] => https://www.nextafter.com/experiments/how-visually-realigning-and-streamlining-a-donation-ask-affects-donations/attachment/streamlined_widget-jpg-9/
[alt] =>
[author] => 0
[description] =>
[caption] =>
[name] => streamlined_widget-jpg-9
[status] => inherit
[uploaded_to] => 15167
[date] => 2022-12-01 22:47:00
[modified] => 2022-12-01 22:47:00
[menu_order] => 0
[mime_type] => image/jpeg
[type] => image
[subtype] => jpeg
[icon] => https://nextafter-1a91a.kxcdn.com/wp-includes/images/media/default.png
[width] => 855
[height] => 559
[sizes] => Array
(
[thumbnail] => https://nextafter-1a91a.kxcdn.com/wp-content/uploads/Streamlined_Widget-7-150x150.jpg
[thumbnail-width] => 150
[thumbnail-height] => 150
[medium] => https://nextafter-1a91a.kxcdn.com/wp-content/uploads/Streamlined_Widget-7-300x196.jpg
[medium-width] => 300
[medium-height] => 196
[medium_large] => https://nextafter-1a91a.kxcdn.com/wp-content/uploads/Streamlined_Widget-7-768x502.jpg
[medium_large-width] => 640
[medium_large-height] => 418
[large] => https://nextafter-1a91a.kxcdn.com/wp-content/uploads/Streamlined_Widget-7.jpg
[large-width] => 640
[large-height] => 418
[1536x1536] => https://nextafter-1a91a.kxcdn.com/wp-content/uploads/Streamlined_Widget-7.jpg
[1536x1536-width] => 855
[1536x1536-height] => 559
[2048x2048] => https://nextafter-1a91a.kxcdn.com/wp-content/uploads/Streamlined_Widget-7.jpg
[2048x2048-width] => 855
[2048x2048-height] => 559
[ab-block-post-grid-landscape] => https://nextafter-1a91a.kxcdn.com/wp-content/uploads/Streamlined_Widget-7-600x400.jpg
[ab-block-post-grid-landscape-width] => 600
[ab-block-post-grid-landscape-height] => 400
[ab-block-post-grid-square] => https://nextafter-1a91a.kxcdn.com/wp-content/uploads/Streamlined_Widget-7-600x559.jpg
[ab-block-post-grid-square-width] => 600
[ab-block-post-grid-square-height] => 559
[tp-image-grid] => https://nextafter-1a91a.kxcdn.com/wp-content/uploads/Streamlined_Widget-7.jpg
[tp-image-grid-width] => 700
[tp-image-grid-height] => 458
[post-thumbnail] => https://nextafter-1a91a.kxcdn.com/wp-content/uploads/Streamlined_Widget-7-150x150.jpg
[post-thumbnail-width] => 150
[post-thumbnail-height] => 150
[admin] => https://nextafter-1a91a.kxcdn.com/wp-content/uploads/Streamlined_Widget-7-50x33.jpg
[admin-width] => 50
[admin-height] => 33
[full] => https://nextafter-1a91a.kxcdn.com/wp-content/uploads/Streamlined_Widget-7.jpg
[full-width] => 855
[full-height] => 559
[thumb_372] => https://nextafter-1a91a.kxcdn.com/wp-content/uploads/Streamlined_Widget-7-372x243.jpg
[thumb_372-width] => 372
[thumb_372-height] => 243
[single_post_thumbnail] => https://nextafter-1a91a.kxcdn.com/wp-content/uploads/Streamlined_Widget-7.jpg
[single_post_thumbnail-width] => 855
[single_post_thumbnail-height] => 559
[thumb_32_32] => https://nextafter-1a91a.kxcdn.com/wp-content/uploads/Streamlined_Widget-7-32x21.jpg
[thumb_32_32-width] => 32
[thumb_32_32-height] => 21
[thumb_48_48] => https://nextafter-1a91a.kxcdn.com/wp-content/uploads/Streamlined_Widget-7-48x31.jpg
[thumb_48_48-width] => 48
[thumb_48_48-height] => 31
[thumb_64_64] => https://nextafter-1a91a.kxcdn.com/wp-content/uploads/Streamlined_Widget-7-64x42.jpg
[thumb_64_64-width] => 64
[thumb_64_64-height] => 42
[thumb_128_128] => https://nextafter-1a91a.kxcdn.com/wp-content/uploads/Streamlined_Widget-7-128x84.jpg
[thumb_128_128-width] => 128
[thumb_128_128-height] => 84
[thumb_122_67] => https://nextafter-1a91a.kxcdn.com/wp-content/uploads/Streamlined_Widget-7-102x67.jpg
[thumb_122_67-width] => 102
[thumb_122_67-height] => 67
[thumb_153_153] => https://nextafter-1a91a.kxcdn.com/wp-content/uploads/Streamlined_Widget-7-153x100.jpg
[thumb_153_153-width] => 153
[thumb_153_153-height] => 100
[thumb_130_163] => https://nextafter-1a91a.kxcdn.com/wp-content/uploads/Streamlined_Widget-7-130x85.jpg
[thumb_130_163-width] => 130
[thumb_130_163-height] => 85
[thumb_232_177] => https://nextafter-1a91a.kxcdn.com/wp-content/uploads/Streamlined_Widget-7-232x152.jpg
[thumb_232_177-width] => 232
[thumb_232_177-height] => 152
[thumb_272_325] => https://nextafter-1a91a.kxcdn.com/wp-content/uploads/Streamlined_Widget-7-544x356.jpg
[thumb_272_325-width] => 544
[thumb_272_325-height] => 356
[thumb_271_346] => https://nextafter-1a91a.kxcdn.com/wp-content/uploads/Streamlined_Widget-7-271x177.jpg
[thumb_271_346-width] => 271
[thumb_271_346-height] => 177
[thumb_271_271] => https://nextafter-1a91a.kxcdn.com/wp-content/uploads/Streamlined_Widget-7-271x177.jpg
[thumb_271_271-width] => 271
[thumb_271_271-height] => 177
[thumb_272_172] => https://nextafter-1a91a.kxcdn.com/wp-content/uploads/Streamlined_Widget-7-263x172.jpg
[thumb_272_172-width] => 263
[thumb_272_172-height] => 172
[thumb_372_461] => https://nextafter-1a91a.kxcdn.com/wp-content/uploads/Streamlined_Widget-7-372x243.jpg
[thumb_372_461-width] => 372
[thumb_372_461-height] => 243
[thumb_372_500] => https://nextafter-1a91a.kxcdn.com/wp-content/uploads/Streamlined_Widget-7-372x243.jpg
[thumb_372_500-width] => 372
[thumb_372_500-height] => 243
[thumb_385_270] => https://nextafter-1a91a.kxcdn.com/wp-content/uploads/Streamlined_Widget-7-385x252.jpg
[thumb_385_270-width] => 385
[thumb_385_270-height] => 252
[thumb_416_241] => https://nextafter-1a91a.kxcdn.com/wp-content/uploads/Streamlined_Widget-7-369x241.jpg
[thumb_416_241-width] => 369
[thumb_416_241-height] => 241
[thumb_448_410] => https://nextafter-1a91a.kxcdn.com/wp-content/uploads/Streamlined_Widget-7-448x293.jpg
[thumb_448_410-width] => 448
[thumb_448_410-height] => 293
[thumb_448_410_retina] => https://nextafter-1a91a.kxcdn.com/wp-content/uploads/Streamlined_Widget-7.jpg
[thumb_448_410_retina-width] => 855
[thumb_448_410_retina-height] => 559
[thumb_574_382] => https://nextafter-1a91a.kxcdn.com/wp-content/uploads/Streamlined_Widget-7-574x375.jpg
[thumb_574_382-width] => 574
[thumb_574_382-height] => 375
[thumb_776_395] => https://nextafter-1a91a.kxcdn.com/wp-content/uploads/Streamlined_Widget-7-604x395.jpg
[thumb_776_395-width] => 604
[thumb_776_395-height] => 395
) ) )
Results
| | Treatment Name | Conv. Rate | Relative Difference | Confidence | Average Gift |
|---|
| C: | Control | 0.07% | | | $0.00 |
| T1: | Streamlined Widget | 0.07% | 9.3% | 95.4% | $0.00 |
This experiment has a required sample size of 1,365,250 in order to be valid. Since the experiment had a total sample size of 2,839,184, and
the level of confidence is above 95% the experiment results are valid.
Flux Metrics Affected
The Flux Metrics analyze the three primary metrics that affect revenue (traffic, conversion rate, and average gift).
This experiment produced the following results:
0% increase in traffic
× 9.3% increase in conversion rate
× 0% increase in average gift
Key Learnings
The treatment produced an overall 9.3% lift in donations to the site. The primary factor affecting this increase in donations was not an increase in motivation, but a decrease in friction that brought the value proposition closer to the reader—evidenced by a 55.4% increase in clicks to the donation page.
Traffic to these journal pages is mostly made up (70%) of mobile users—and the mobile version of this page produced a 33% increase in conversion, with 100% validity.
The increase in traffic to this test gives CaringBridge a better chance of validating donation page tests—and shows the potential impact of increasing downstream conversion, especially on mobile devices.