The effect of a reverse (high to low) gift array on donations
CaringBridge
CaringBridge offers free personal, protected websites for people to easily share updates and receive support and encouragement from their community during a health journey. Every 7 minutes, a CaringBridge website is created for someone experiencing a health event.
Experiment Summary
Timeframe: 03/26/2018 - 04/02/2018
Gift arrays have always been a point of interest for fundraisers. We’ve tested different amounts, different options, different minimums. We’ve even eliminated the array in favor of an open field. What we have not tested is the order in which to present the amounts.
Many nonprofits online, across all different verticals, when using a gift array choose to show the largest suggested amount first, rather than the lowest suggested amount, likely in hopes that donors will give more.
Does this matter? Especially for CaringBridge donors, who have been quite responsive in helping us understand gift arrays to-date.
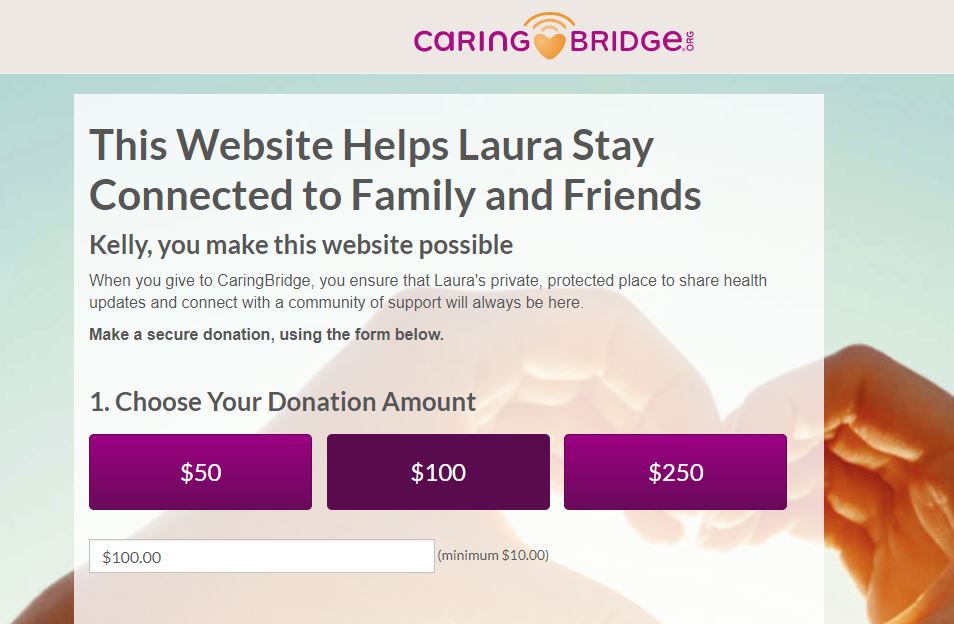
How we test this: The control (original) keeps the standard rising suggested amount approach (start with the lowest ($50) on the left (assuming visitors in this case naturally read left to right) and then end with the highest ($250)
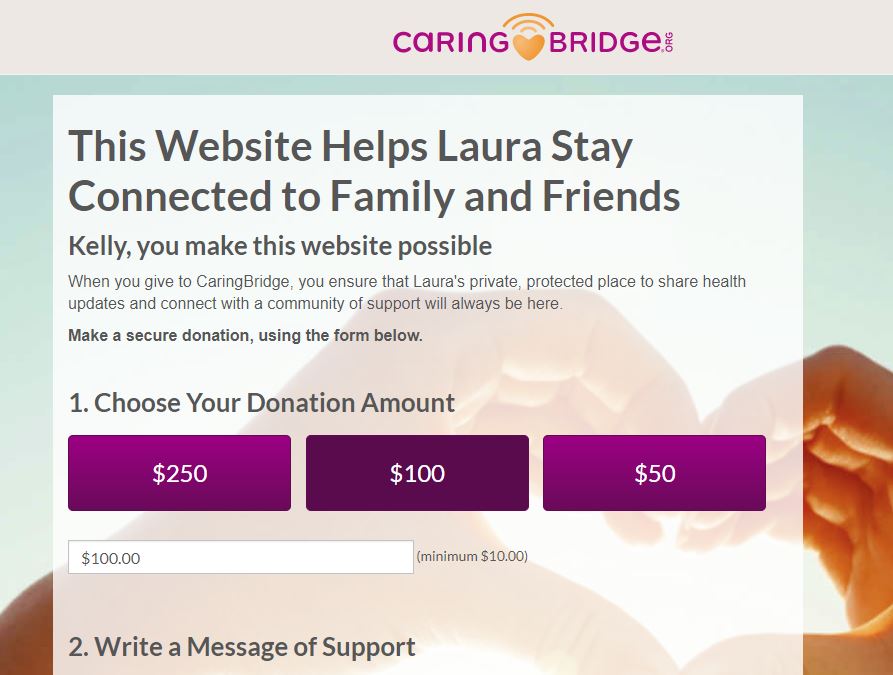
The treatment, however, reverses this, by starting with the highest amount first in the eyepath (in this case, left).
Research Question
Which gift array arrangement will produce the greatest donation rate?
Design
Results
| Treatment Name | Conv. Rate | Relative Difference | Confidence | Average Gift | |
|---|---|---|---|---|---|
| C: | Standard Gift Array (low to high) | 30.4% | $53.29 | ||
| T1: | Reverse Gift Array (high to low) | 25.7% | -15.7% | 95.1% | $47.28 |
This experiment has a required sample size of 675 in order to be valid. Since the experiment had a total sample size of 1,356, and the level of confidence is above 95% the experiment results are valid.
Flux Metrics Affected
The Flux Metrics analyze the three primary metrics that affect revenue (traffic, conversion rate, and average gift). This experiment produced the following results:
0% increase in traffic
× 15.7% decrease in conversion rate
× 11.3% decrease in average gift
25.2% decrease in revenue
Key Learnings
By showing the larger amount first, visitors were LESS likely to donate, and LESS likely to give in larger amounts.
But why?
When you think about the donation array, or suggested giving amounts, it all comes down to permission; meaning, what do we, as an organization, want the reader to believe is an ACCEPTABLE amount to give, and thus completely satisfy and receive that warm glow of giving?
By starting with a higher number first, we likely gave visitors the impression that lower amounts are LESS acceptable, despite them being on the list still. (for the same reason “other” is on the list… we won’t refuse their money, but maybe they will imagine us giving them a weird/disappointed look when they do)
Thus, because those visitors perceived their smaller donation was less acceptable, they chose not to donate at all.
Now, as for the drop in average gift approaching validity, this is likely due to the potential upgrade effect that happens when amounts are suggested in that rising order. By starting low, making the low amount feel acceptable, it is possible they feel like they can share a greater feeling of warmth by giving more, whereas in the opposite condition, giving just a little bit more doesn’t seem to mean any more than giving the original amount, due to its presentation.