How ordering the steps of the initial step of a donation process affects conversion
CaringBridge
CaringBridge offers free personal, protected websites for people to easily share updates and receive support and encouragement from their community during a health journey. Every 7 minutes, a CaringBridge website is created for someone experiencing a health event.
Experiment Summary
Timeframe: 09/17/2020 - 09/25/2020
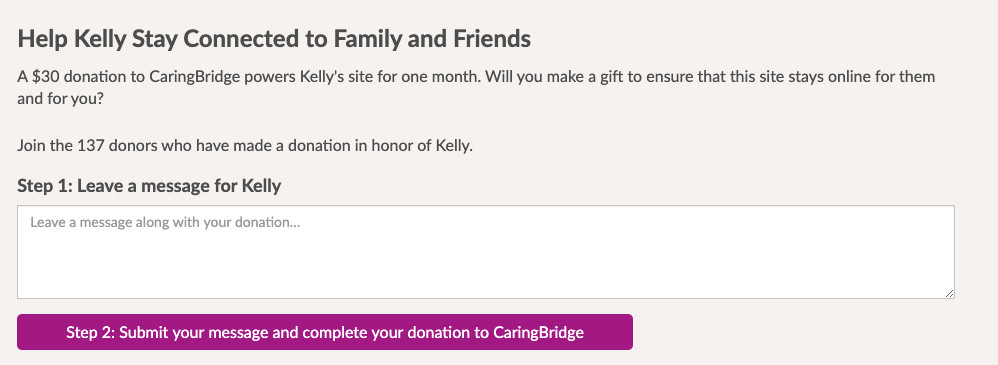
CaringBridge’s tribute widget generated the majority of their donations by asking users to make a gift, then making the first step of that gift be a message to go to their friend along with their gift. This widget, in the CaringBridge site, sent tons of traffic to the donation page—but the first step was a simple comment box. The team wondered if their familiarity bias might be keeping them from understanding if users really knew how the widget worked, and what they were supposed to do. Was it clear enough? They created a treatment that numbered the steps: Step 1: Leave a message for KellyStep 2 (on the donation button): Submit your message and complete your donation to CaringBridge.
They hypothesized that breaking these steps down and ordering them would increase donor conversion through this funnel.
Research Question
How ordering the steps of the initial step of a donation process affect conversion?
Design

Results
| Treatment Name | Conv. Rate | Relative Difference | Confidence | Average Gift | |
|---|---|---|---|---|---|
| C: | Control | 0.23% | |||
| T1: | Ordered Steps | 0.29% | 21.9% | 98.2% |
This experiment has a required sample size of 71,381 in order to be valid. Since the experiment had a total sample size of 361,977, and the level of confidence is above 95% the experiment results are valid.
Flux Metrics Affected
The Flux Metrics analyze the three primary metrics that affect revenue (traffic, conversion rate, and average gift). This experiment produced the following results:
0% increase in traffic
× 21.9% increase in conversion rate
× 0% increase in average gift
Key Learnings
The treatment, with the ordered steps, increased revenue by 21.9%. This revealed a hidden secret: it may not have been clear to donors exactly what they were supposed to do with the tribute widget, regardless of how familiar it was to the CaringBridge team. This presents a host of opportunities to look at various elements of the CaringBridge site and perform more optimization experiments specifically centered around increasing clarity on “how this works”.
Of particular notice in this experiment:
Mobile devices had a much higher than average lift at 28%New visitors had a 45% increase in conversion rate