Life is full of disappointments big and small.
And, unfortunately, A/B testing is no different. Why?
Because not every A/B test you run will produce a valid result.
We’ve run thousands of A/B tests over the past 10+ years. And a good portion of them never reached statistical significance — which is what we mean by a valid result.
What exactly is statistical significance?
First of all, it’s not just something we made up for fundraising.
From a statistical perspective, significance (or level of confidence) measures your likelihood of a “false positive.”
What is a false positive?
An a/b test is trying to measure if your treatment (Version B) is in fact better performing than your control (Version A). A “false positive” would mean you measured a significant change, but in reality, there is in fact no difference.
If you run a test, see an increase in giving from Version B, and get an 80% level of confidence—it means that there’s a 20% chance that there is actually no difference in performance between the two variants.
Different applications of a/b testing require different levels of confidence. Pharmaceutical companies running tests on drug trials and medicine aim for something closer to a 99%+ level of confidence. A business trying to get market intelligence from a survey may aim for an 80% level of confidence.
I’m no statistician myself. So don’t be intimidated by all the numbers and fancy statistics vocabulary. The math behind valid a/b testing can get complicated.
Which is why we always recommend using a validity calculator to make your life easier.
When it comes to a/b testing in fundraising, we aim for a 95% level of confidence before declaring the treatment a winner—meaning that there is only a 5% chance that the result of the test is “random” rather than a true difference in performance.
What if my result is less than a 95% level of confidence?
OK, so you’ve taken the time to set up your A/B test. You’ve let it run for 30 days. You plug in your metrics to the validity calculator, and …
** Womp, womp **
Your brilliant test idea didn’t reach a 95% level of confidence. Let’s say it’s sitting at 85%.
You may be tempted to think you wasted your time, and you should give up on a/b testing.
Don’t fret! If you’ve done your homework on how to run a proper a/b test, you know that the goal of a single test is not to get a lift. The goal of a test is to get a learning.
You can obviously learn from wins. And you can often learn even more from losses. But a test that doesn’t validate? It kind of leaves you scratching your head.
So where do you go from here?
What to do when an A/B test doesn’t validate
When you find yourself with an A/B test that doesn’t reach statistical significance, you really have 3 options you can choose to pursue.
Option 1: Give Up. Abandon all hope.

Sadly, this is probably the most common course of action when an A/B test doesn’t validate.
You ran your test. It didn’t validate. So you pack it in.
You throw up your hands and say, “OK, we tried. We did our best. We thought it was great,” and you move on to the next test.
This is a really common reaction to invalid A/B test results…but there is a better way.
Option 2: Develop your own statistical model based on what you wish the result had been.

This is perhaps the most dangerous option — and certainly one we don’t recommend.
But again, it’s really common for someone running an A/B test to re-frame the test in a way that achieves a desired result. Here’s what this often looks and sounds like:
- Ignoring the level of confidence altogether.
- “It’s not valid, but it’s trending positive!”
- “It’s not valid, but we saw it make a big difference for [INSERT SPECIFIC AUDIENCE]!”
The reality is there is no such thing as an “almost valid” experiment. If we’re true to the science, it either is or it isn’t.
While there’s good intentions behind the kinds of phrases listed above, it’s more beneficial for us to fully understand what the true implications are of an invalid result.
Which is why I highly recommend Option 3 if you have an “invalid” result…
Option 3: Learn what you can, understand the risks, and re-test as needed.

So you’ve run an a/b test and didn’t reach your 95% level of confidence.
Here’s what to do…
Learn what you can.
Revisit your hypothesis. Sometimes you realize after running your test that you may have tweaked too many variables. If so, it’s time to redesign your test, control all the right variables, and run it again.
- What exactly were you testing?
- In hindsight, does your treatment actually support your original hypothesis?
Drill into segments. Hunting around in your data for a winning segment is never a great idea. You’re almost always going to find a winning audience segment, but your result will likely be a false positive.
If you find big fluctuations in specific segments, use these as clues to develop a new hypothesis and run an additional experiment.
Understand the Risks
When you have an “invalid” experiment, the most likely scenario is that there is no detectable difference in the performance between Version A and Version B.
Even if your level of confidence is as high as 80% still means that there’s a 1 in 5 chance that your change in performance is a result of random chance.
This is where a good optimizer needs a healthy understanding of risk analysis for your organization and fundraising.
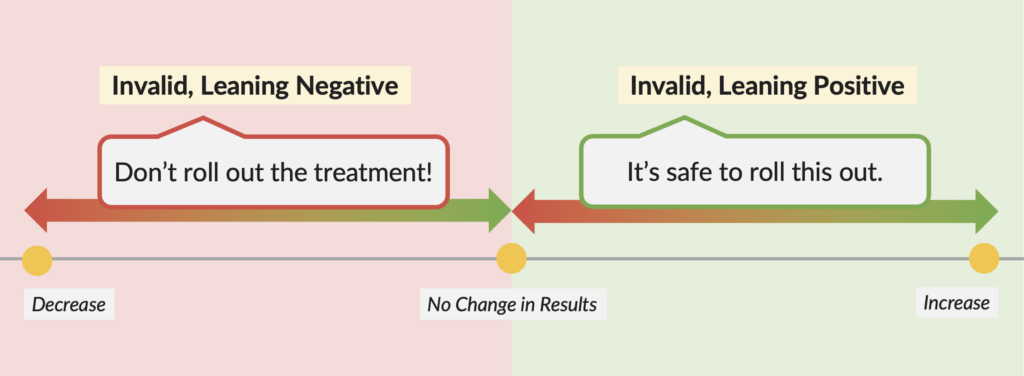
Invalid, Leaning Negative
If your 80% level of confidence a/b test is paired with a negative impact on clicks, donations, revenue, etc—your best course of action is to stick with your control (Version A).
Even if you really, really like your treatment, don’t roll it out!
The best case scenario is that there is no difference in performance. But there is risk that your treatment is in fact harming your results.
Invalid, Leaning Positive
If your 80% level of confidence a/b test is paired with a positive impact on clicks, donations, revenue, etc—you can roll out your treatment with minimal risk (Version B).
The most likely scenario is that Version B has no difference in performance. But there is still a chance that you have “false negative”, and that Version B is in fact better performing than Version A.
The risk of your treatment being a negative performer is very low, and there is significant upside.
Re-testing Your Hypothesis
If you did your research to develop a solid hypothesis, it may be worth running a re-test.
It’s always possible you had a “false negative” result. A “false negative” means that your treatment is a better performer,, but you were unable to measure it during the initial experiment.
If your experiment is based on quality research or you’ve seen many other examples in the NextAfter research library where a specific hypothesis has led to an increase, it may be worth running a re-test.
Here’s a short summary of how to treat invalid results:
- Invalid, Flat: Not a motivational factor.
- Invalid, Negative: Do not roll out the treatment.
- Invalid, Positive: You can roll out the treatment with minimal risk.
But ultimately you want to learn something about your ideal donor from your A/B test.
So let’s take a look at a few recent experiments from our library of 5,500+ digital fundraising case studies—experiments that did not validate but do, however, provide valuable insights into donor motivation.
Learning from an invalid A/B test results | Two Examples
So again, if you’re running any sort of A/B test — whether that be on an email, an ad, a homepage, a donation page, or any other digital fundraising asset — the most important thing is to learn something about what motivates your donors to act.
The experiments below have relatively small sample sizes, which again is more likely to produce A/B tests with invalid results.
But that doesn’t mean there aren’t valuable insights we can take away from these experiments!
An A/B test resulting in an invalid decrease
In our first example of an invalid test, our hypothesis was that removing non-essential fields on a donation form would increase donation rates by reducing friction.

In the treatment, we hid the following “non-essential” form fields and options:
- Option to add an additional gift designation
- Pre-fix
- Middle Name
- Company Name
- Tribute option
- Option to give “anonymously”
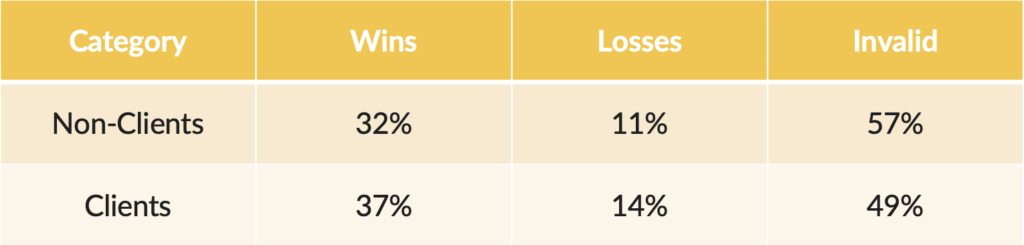
When we ran this experiment, we actually saw a 32 percent decrease in donations at an 89 percent level of confidence — highlighting the importance of testing even if you’re really, really sure your idea is going to work.
There is a fairly high level of confidence in this result, but remember, you cannot have an almost valid result. And we’re aiming for a 95% level of confidence to be “valid.”
Because this outcome wasn’t what we anticipated based on past learnings, it just screams to me that there’s a deeper learning to pull away from this test.
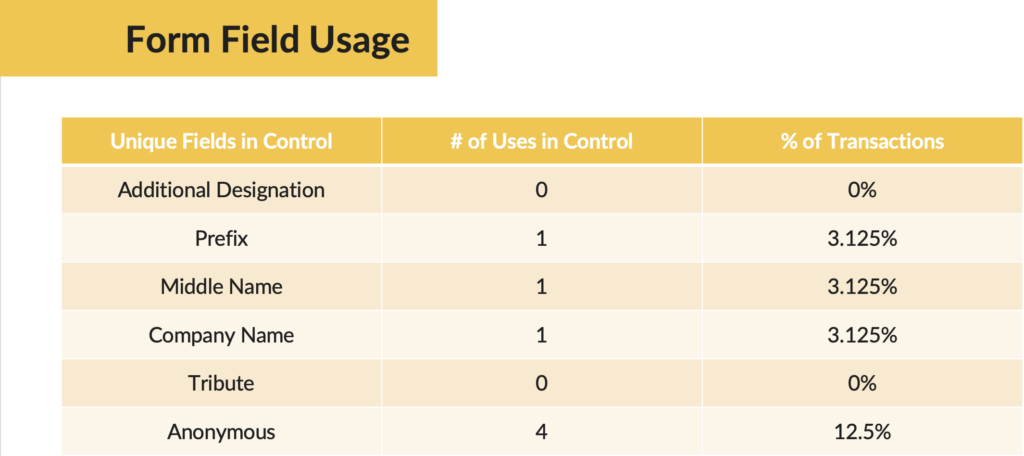
We dove in and pulled all the transactions from the control to look at whether one of the form fields that we hid in the treatment was heavily utilized by donors in the control group.
Here’s what we saw:
The field with the most significant impact is the option to keep the donation anonymous. So it’s possible that the “make my gift anonymous” field is actually a motivator.
In fact, if we assume that there were 4 conversions lost in the treatment because of the hidden “anonymous” checkbox, our conversion rates become essentially the same between control and treatment.
We weren’t able to say with absolute certainty that there’s a difference between these two, but we have some clues that may lead to valuable insights and future test ideas. And they cause us to ask important questions about these donors:
- Is it important for some donors to give anonymously?
- What do donors think it means to give anonymously? What’s the core motivation?
- Are donors willing to be more generous if they know they won’t be recognized publicly for their gift?
An A/B test resulting in an invalid increase
Below is an example of a recent test that produced an increase but did not validate.
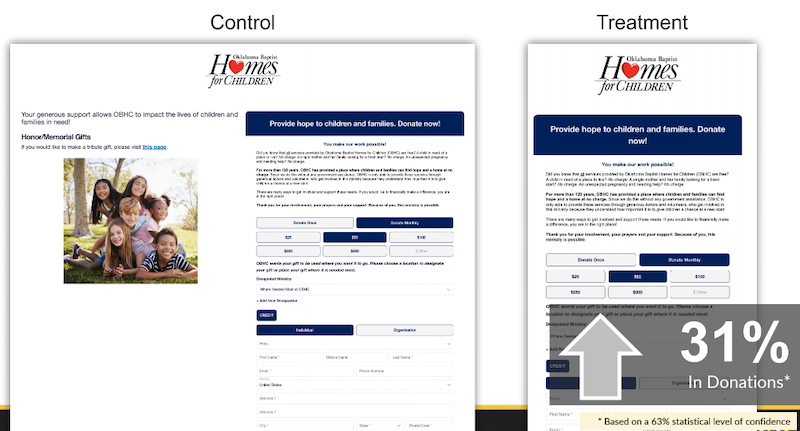
The control shown above is a two-column donation page. And the treatment is a single-column donation page.
The only difference between the two is that we took all the copy about other ways to give from the left column of the control and moved it down below the form in a single-column format on the treatment, hypothesizing that it would not be a primary motivating factor for donors.
And by making this change we saw a 31% lift in donations … but with only a 63% level of confidence.
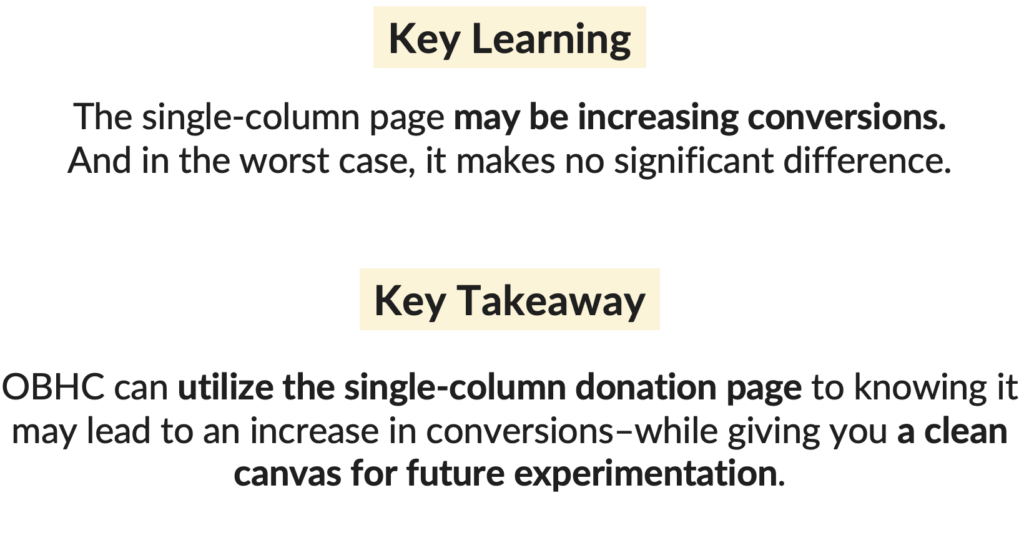
So going back to our rule of thumb, there’s no such thing as an almost valid test.
But as we mentioned before, there is really very little risk associated with rolling out a positive result that does not validate.
In the worst case, there’s no change. But there’s also a chance that yes, in fact, this change will produce positive results over time, we just weren’t able to measure that during our testing time frame.
And in this case, a single column donation page gives us a better canvas for testing things like the copy and messaging on the page since it’s easier to control the order that someone reads through the copy.
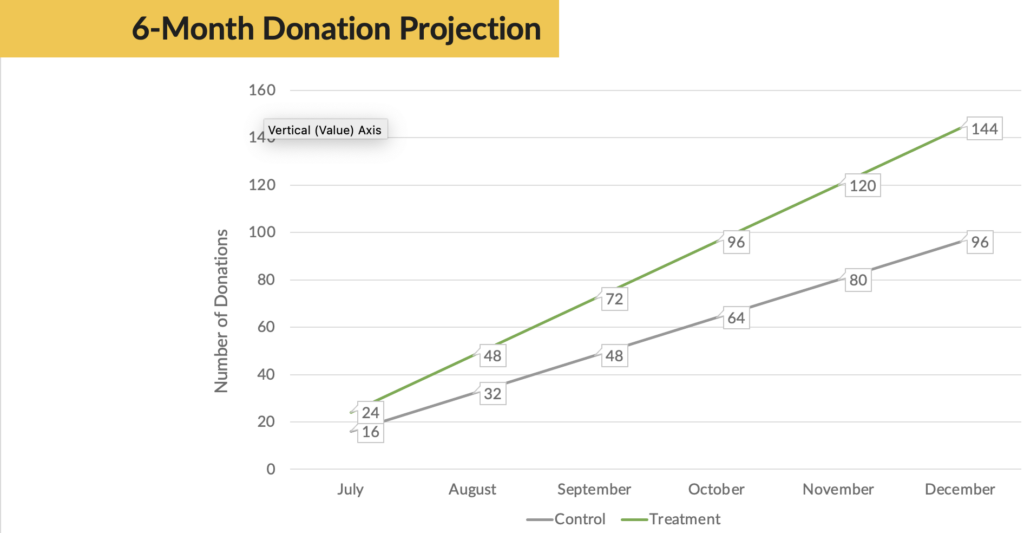
And if the 31% increase were to hold over a 6-month period, this organization would actually see a 50% increase in donations.
As a results-driven fundraiser, I’d rather err on the side of there being a chance of an uplift. And I can monitor my results over time to measure the total growth of my program.
In short…there’s a lot of potential upside in rolling out the treatment with really no risk!
Plus we’ve created a donation page layout that is easier to test going forward — a win/win.
Wrapping things up
Not every test you run will validate — this is just the reality of A/B testing.
Especially if your organization does not have a lot of traffic, it can be hard to reach a “valid” result. So start testing in the areas you have the highest traffic volume. Learn what you can. And incrementally work towards growth.
And in fact, it’s only by testing that you can truly know what is motivating your donors. Not by reading best practices. Not by looking at what everyone else is doing.
Being a student of fundraising is necessary to generate ideas, but the only way to actually know what works is by committing your team to A/B testing.
And if you’ve designed your tests in an effective way, there’s always something to learn and there’s always data to dive into for clues that are going to tell you more about your donor and inform your next test.
And that’s the whole point of running these tests!
You should always be trying to understand your donors. You should always be pulling some learning from your tests — then, no matter the result, you are getting value from your testing program.
Whether a test is valid or invalid, there’s always something to learn. And always remember this basic rule of thumb for what to do when a test does not reach statistical significance:
- Invalid, Flat: Not a motivational factor.
- Invalid, Negative: Do not roll out the treatment.
- Invalid, Positive: You can roll out the treatment with minimal risk.
Happy optimizing!