

By now you’ve heard the news: Google Analytics 4 is set to replace Universal Analytics. Soon.
In fact, if you’ve recently logged into your Universal Analytics account (often called GA3), you’ve no doubt seen Google’s none-too-subtle reminder…
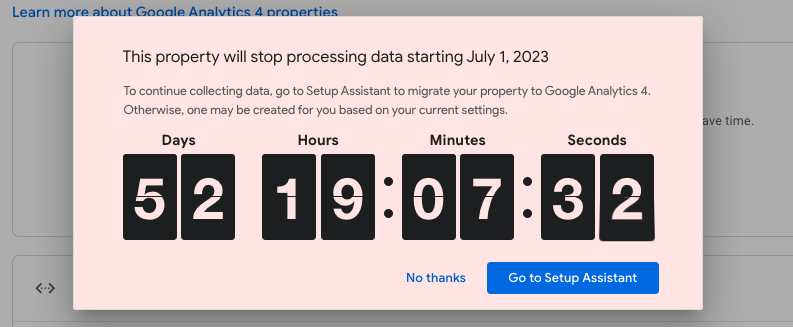
So in case you’ve been crossing your fingers and toes and hoping against hope that maybe Google would change its mind about forcing nonprofits to migrate over to GA4 . . .
Now is the time to abandon that hope and begin the migration process.
Luckily, Google provides a GA4 setup assistant to help you get started. But we definitely recommend enlisting the help of your dev and data teams to reduce the anxiety of making the leap from Universal Analytics to GA4.
By the way: if you’re looking for a step-by-step, in-depth guide to setting up and using GA4—created just for digital fundraisers and nonprofit organizations—you can get free access to our comprehensive course, Google Analytics 4 for nonprofits, expertly taught by Chris Mercer, founder of Measurement Marketing.
The Difference between GA4 and UA
In the digital analytics landscape, GA4 represents a significant evolution from its predecessor, Universal Analytics (UA).
But if you’re used to the interface of Universal Analytics, it can feel overwhelming to try to make sense of GA4’s layout—at least at first. As with any new tool or platform, the more time you spend working with it, the less intimidating it becomes.
And the truth is that GA4 is ultimately more user-friendly (once you get the hang of it), offering more control and more valuable insights for digital fundraisers like you!
We won’t go too deep into the technical details here, but from a user’s perspective, there are several key differences between UA and GA4 that you’ll want to be aware of:
- User Interface: GA4 introduces a redesigned interface that is more streamlined compared to UA. It may look confusing at first but actually allows you to keep the data and insights most important to your organization at your fingertips.
- Data Model: UA uses a session-based data model, which focuses on tracking user interactions within specific time frames. GA4, on the other hand, adopts an event-driven data model that tracks user actions as a series of events. This shift allows for more flexibility in tracking and understanding user behavior across different devices and platforms.
- Reporting: GA4 offers a new set of pre-built reports that are more focused on actionable insights, compared to the more traditional reports in UA. There are far fewer reports out of the box, but these can be customized more to fit your needs. Users can also access Explorations, which provides advanced analysis techniques and customizable visualization options.
- Audience Segmentation: GA4 introduces improved audience segmentation capabilities, making it easier for users to create and analyze specific user segments based on their behavior and interactions with the website or app. Audiences you identify in GA4 can also be pushed directly to Google Ads for targeting or exclusion.
- Cross-platform tracking: While UA requires separate properties and data views to analyze data from different platforms, GA4 enables cross-platform tracking by default, allowing users to track user behavior across websites and apps within a single property.
- Machine learning and AI-driven insights: GA4 leverages machine learning and artificial intelligence to provide automated insights and predictive analytics. These features help you identify trends and potential opportunities you may have missed in UA.
- Integration with Google Marketing Platform: GA4 is designed to integrate more seamlessly with other Google Marketing Platform tools, making it easier for users to manage their advertising efforts and analyze cross-channel marketing campaigns.
So while it may seem like a lot to take in at first, trust us: GA4 has the potential to be a game-changer for your nonprofits by streamlining and powering up the insights you glean from your data.
How GA4 Data is Structured
The most fundamental difference between GA4 and UA is the improvement in how collected data is structured.
GA4 utilizes an event-based tracking system, as opposed to session-based tracking in UA, which allows for more flexibility in tracking user interactions. In GA4, everything is tracked as an event, including page views, clicks, and other user interactions.
For digital fundraisers, this means you can now track a wider range of user interactions on your website, such as button clicks, form submissions, and video views, which GA4 treats as first-class citizens just like page views. Unlike UA, these events don’t impose unintuitive hierarchies, but instead let you decide what parameters are important
And this can help you better understand how users engage with your content, allowing you to make better data-driven insights, segment your audience, optimize your fundraising campaigns, and target your communications more effectively.
On top of GA4’s improved insight capabilities, its data retention and deletion features can help you maintain compliance with ever-evolving data privacy regulations, such as GDPR, by allowing you to set custom data retention periods and delete user data when required.
How To Set Up GA4
Mercifully, Google has provided a setup assistant to help you with the “out-of-the-box” configuration of your new GA4 account. Here’s how:
- Log in to your Google Analytics Account
- Click Admin (It’s the ⚙️ icon in on bottom left navigation)
- Confirm that the correct account is selected
- Note: because Google has auto-migrated many accounts, double-check that a GA4 account does not already exist for your property
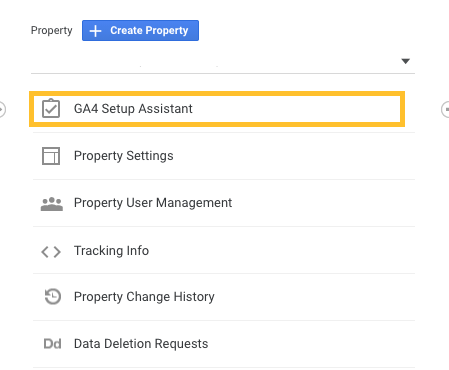
- Confirm that the correct property is selected
- Click GA4 Setup Assistant (the first option in the Property column)
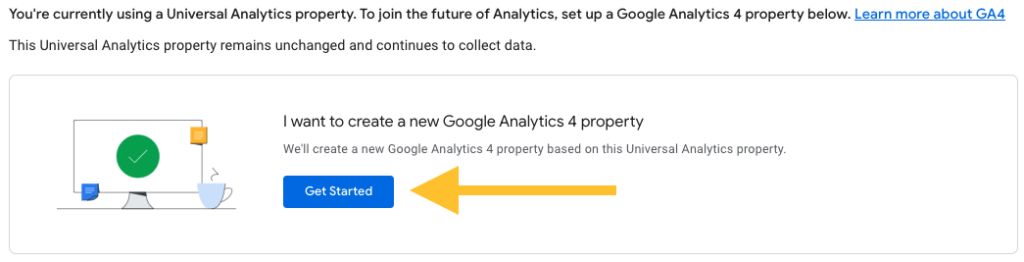
Once inside the Setup Wizard, click the large blue button, Get Started.
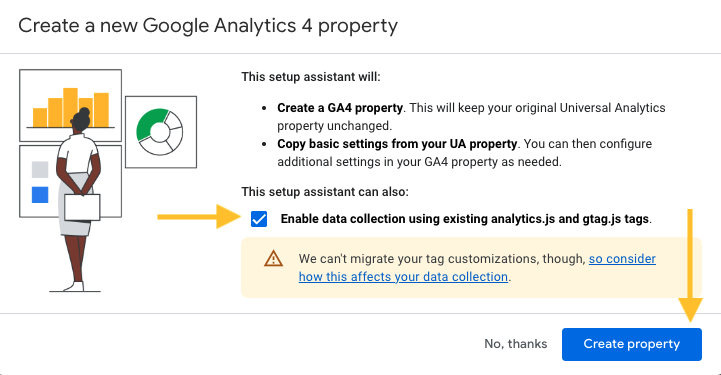
Then, when the pop-up window appears, select the box to “enable data collection using existing analytics.js and gtag.js tags,” click “create property” and voila, you’ve just created your GA4 account.
Once Google sets up your new GA4 property (takes about one second), you’ll see a green confirmation message and a blue button that you can click to head on over to your new property.
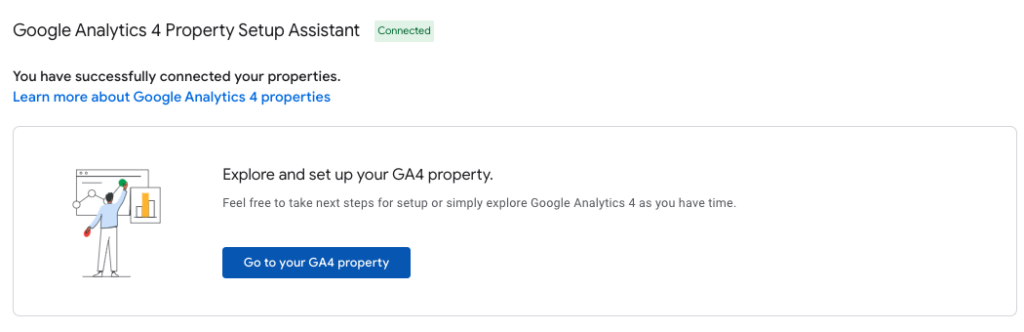
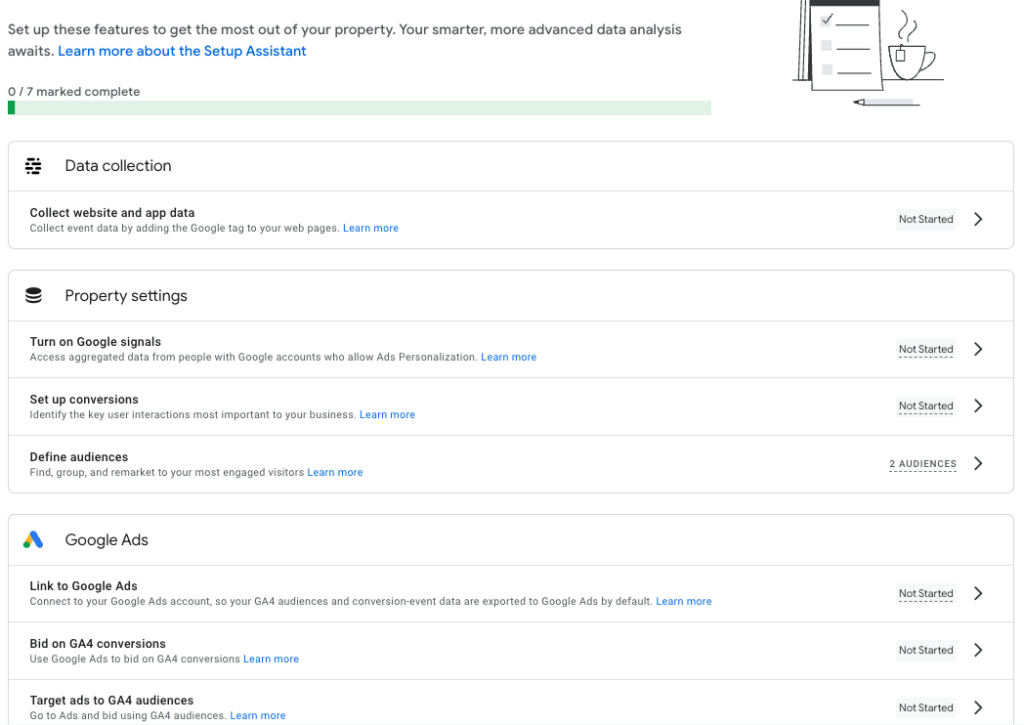
Once there, Google’s helpful setup assistant will provide you with a step-by-step guide to configuring your Google Analytics 4 property.
This is a good time to stand up from your desk, stretch, and refill your hot beverage of choice. When you get back, go through each step of the configuration process to finish the setup process.
Before we go further, it’s worth defining some GA4-specific terms we’ll be using below:
- Event
Anything you track in GA4 is an event, and at minimum, every event has a name. This includes automatically-collected events like page_view, scroll, and session_start, as well as custom events you create for your own needs (e.g. peition_signed, volunteer_pledge, recurring_gift).
Events can be collected through the normal tag (or Google Tag Manager), but can also be created or modified from other events.
If there’s already a similar default event, use that instead of creating your own, as they sometimes have special functionality in the GA4 interface (such as purchase populating the Monetization reports) - Parameter
Additional information attached to an event is called a parameter. Some default events have specific parameters they either allow or require (for purchase this would include amount and transaction_id, for example). Additional parameters can be added to both default and custom events (e.g. adding recurrence_frequency if you want to measure recurring donor acquisition). - Dimension
Whether in parameters or reports, dimensions are things you can name. Think categories, groups, or textual values like “New Visitor” or “Returning Visitor”. - Metric
Unlike dimensions, metrics are things you can count. Think of a number of pages viewed, time on the page, or amount of a donation.
Helpful hints:
1 – Many standard reports will show your high-level data indefinitely, but Explore reports and Audiences are limited by the property’s Data Retention setting. The default is just 60 days—which we recommend changing to the max of 14 months. This will help you avoid the heartburn of attempting to compare to last year’s campaign and . . . it’s not there.
(Note for advanced users: all GA4 properties also offer a free export to Google’s BigQuery data warehouse, previously reserved for only paid GA360 accounts. Here you can retain the data as long as you need and analyze it using SQL. Some orgs set this up as a backup since most sites will fall under the free usage tier.)
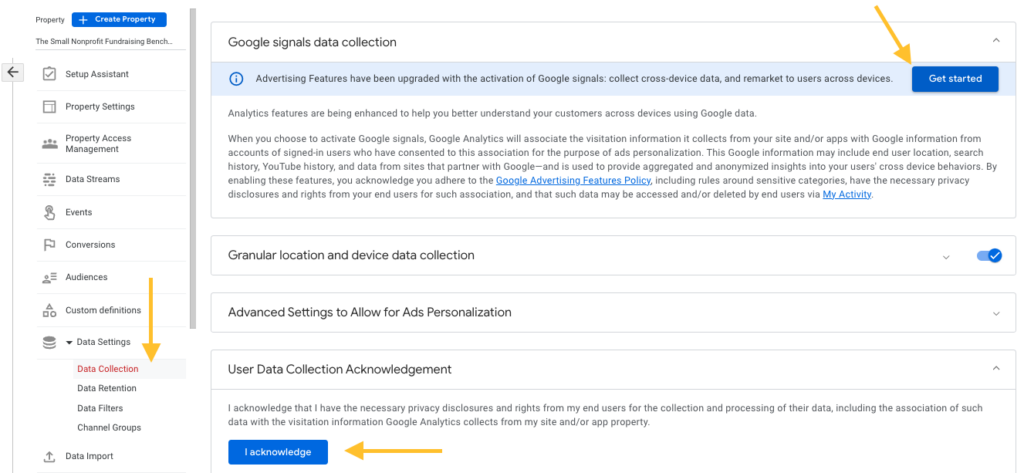
2 – During your setup, activate “Google signals data collection” under the data settings tab (shown below) and acknowledge the User Data Collection Acknowledgement statement. With Google signals activated, you can:
- Show Cross Device remarketing ads to Google users who have left Ads Personalization turned on.
- See demographics such as age and gender for your visitors.
- See new user-based data in the Cross Device reports. Keep in mind that this new data is available starting from the date you activate Google signals.
3 – Ensure “Enhanced Measurement” is turned on under your data stream settings so that you can measure additional (and important) interactions with your content.
To turn enhanced measurement on, navigate to “Data Streams” in the side navigation pane » select the data stream associated with your website » toggle Enhanced Measurement on » click the ⚙️ icon to configure
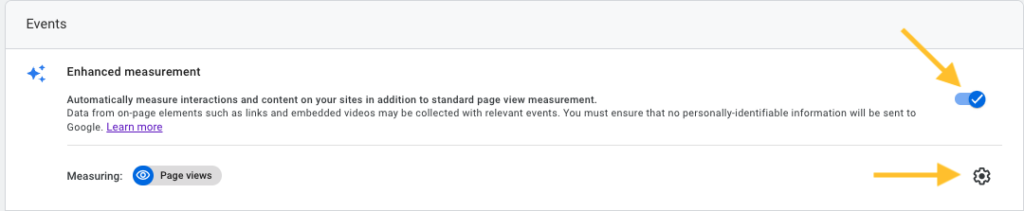
Want to use one of these events with your own more-specific parameters? Just disable the corresponding Enhanced Measurement event to avoid duplication.
*If tracking tags are not set up on your website, you will receive the following warning message:
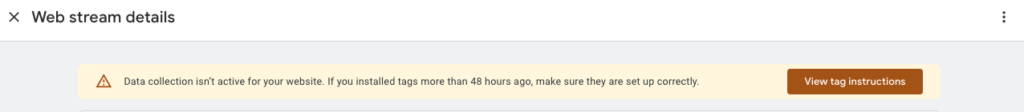
Click “view tag instructions” to get assistance setting this up.
Important note: these instructions will create an “out-of-the-box” Google Analytics 4 property. But it’s up to you to configure that property to meet your organization’s measurement needs.
For a more detailed look at setting up GA4, check out our comprehensive GA4 for Nonprofits course—free for 30 days when you activate your free trial for NextAfter Institute membership.
How to Create Custom Events in GA4 via User Interface
To create events in GA4, you need to modify the parameter data of the new event accordingly.
The good news is that you can do so using the admin section in your GA4 property.
The even better news is that you’re about to learn how!
Step 1: Open GA4, Click Admin, and Go to “Events”
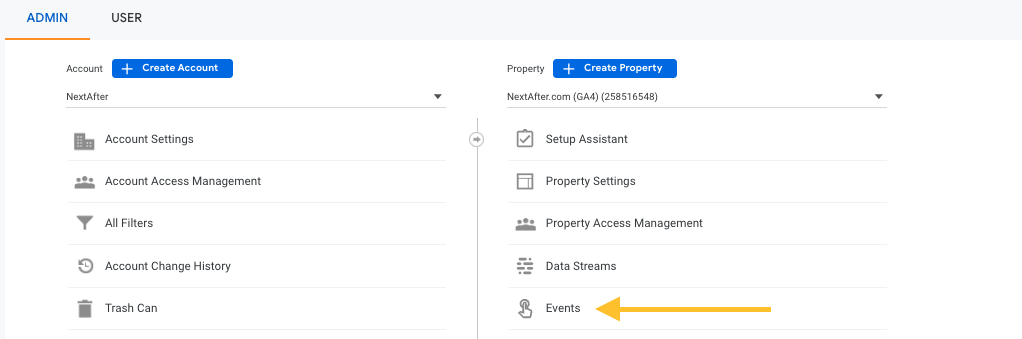
Once you do, you’ll be taken directly to the Custom Events screen, where all existing events will show up.
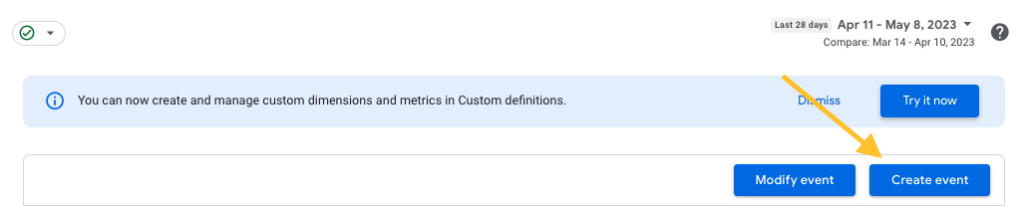
Step 2: Select “Create Event”
Now, look for the blue button at the top right corner of the Events Table that says Create Event.
Click “Create Event,” and move on to the next step.
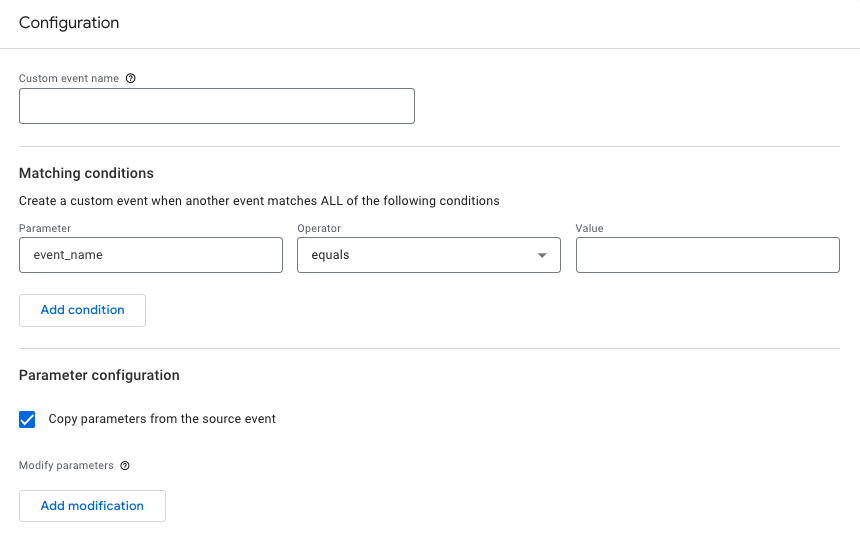
Step 3: Enter Event Name and Conditions
Here’s where the magic happens!
But take your time: each event parameter must be configured properly for it to work as it should.
You should see three conditions and parameters that will determine the way your event works:
- Custom Event Name: under this section, you must name your event based on the “hit” that will record. Use only letters, underscores, and numbers
- Matching Conditions: matching conditions specify the actions that will trigger the event as soon as they take place. You can learn how to specify matching conditions efficiently in this GA4 support article
Parameter Configuration: parameter configuration can be based either on existing events, or you can create your own parameters inside GA4. If you simply want to use the parameters from the original event, select “Copy Parameters from Source Event.”
Step 4: Save the Event and Test Using the Realtime Report
Once your event is configured, simply click the “create” button and you’re almost done.
To see if your new event is firing as it should, go to your website, trigger the matching conditions of the event, and then load your Realtime Report.
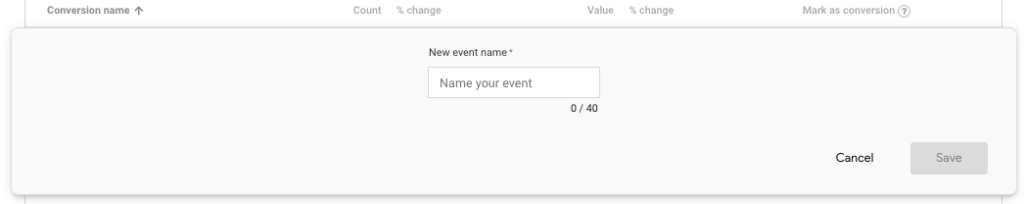
If your new event shows up on the “Event Count by Event Name” card on the Realtime Report, then you know your event is working.Helpful Tip: You can also mark an event as a conversion by navigating to admin » conversions, clicking the “New Conversion Event” button, and naming your conversion exactly as it was named when you created the event.
For a more detailed look at setting up GA4, check out our comprehensive GA4 for Nonprofits course—free for 30 days when you activate your free trial for NextAfter Institute membership.
The comprehensive course above is just for nonprofits and contains everything you could ever need to get the most out of GA4.
GA4 reports every nonprofit fundraiser should know
Navigating GA4 may seem daunting at first . . .
But just like assembling IKEA furniture, the more time you spend tinkering around, the more you’ll get the hang of it—until you’re a flat-pack assembly master of actionable data insights.
Anyway, let’s take a look at some of the most useful reports digital fundraisers can use in GA4, starting with some “standard” reports:
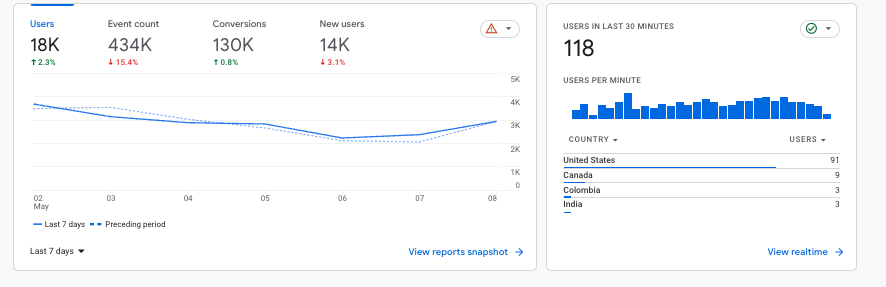
The Home Report
The Home Report provides a centralized overview of key metrics and insights, providing a quick overview of your website’s performance, including acquisition, engagement, and donation analysis. This high-level snapshot can help you identify trends at a glance.
It can quickly answer:
- Where do new users come from?
- What are your top-performing campaigns?
- Which pages and screens get the most views?
Life Cycle Reports
Life Cycle reporting mirrors the process of acquiring, engaging, monetizing, and retaining donors. And they’re ideal for analyzing how users enter the conversion funnel and how they behave once they’re in the funnel.
Life Cycle Reports will quickly answer:
- How is traffic being acquired? (Acquisition Reports)
- How do users behave once they’re on your site? (Engagement Reports)
- What offers and pages are converting my traffic into donors–and how are they being acquired (Monetization Reports)
Acquisition Reports
Under the acquisition tab, you have the option to view Acquisition Overview, User Acquisition, and Traffic Acquisition.
- User Acquisition uses “first user default channel group” to show you how your users were originally acquired, i.e. how they ended up on your site the first time they were tracked to help you identify which channels or campaigns are most effective in attracting first-time visitors.
- Traffic Acquisition provides insights into where new sessions came from, regardless of whether the user is new or returning to help you understand the overall effectiveness of all your marketing efforts. This report is similar to UA’s popular “All Channels” report.
Engagement Reports
Engagement reports provide a look at what events have been fired (Event Report), what conversion events have been completed (Conversion Report), and the pages and landing pages web visitors are engaging with (Pages and Screens and Landing Page Reports).
In each report, you can use the ‘+’ symbol to add additional metrics to your view:
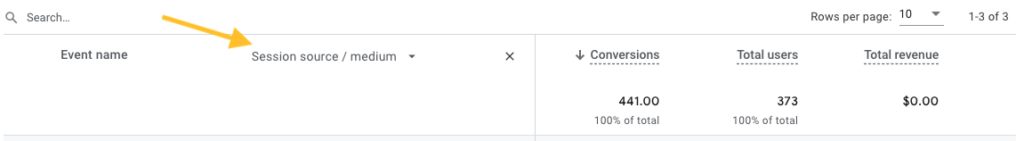
This can help you analyze things such as which sources or campaigns are driving the traffic that is completing each action. Which can help you quantify the efficacy of your different fundraising campaigns.
Monetization Reports
Monetization reports help nonprofits gain insights into their donation performance, user engagement with revenue-generating activities, and the effectiveness of different fundraising strategies.
These reports can help them make data-driven decisions to optimize their campaigns and maximize their fundraising results.
Similar to engagement reports, you can break down results using key dimensions such as Campaign and Source to gain a better understanding of which efforts are producing the most donations and revenue.
You can also use the User Purchase Journey report to determine at which stage of the on-site funnel people are abandoning the donation process—providing insight into where you can optimize your digital assets to increase conversion rates.
Explorations
In addition to standard reports, you will find “Explore” listed in the far left-hand navigation.
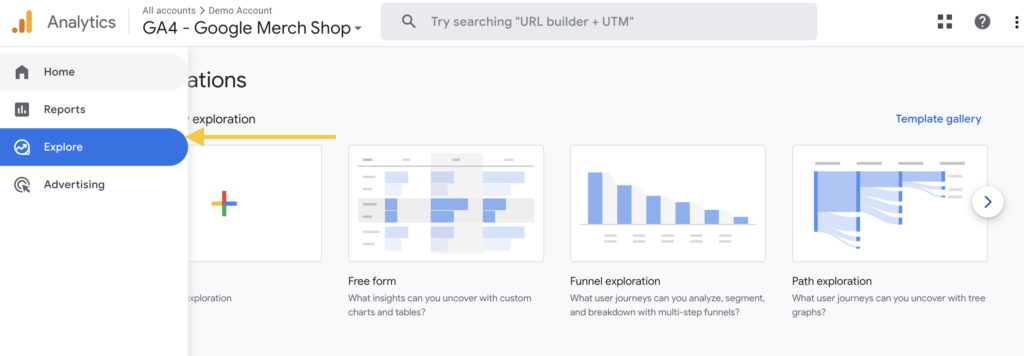
GA4 Explorations provides more control over the data visualization than was previously available in Universal Analytics. But unlike standard reports, Explore only works within the data retention window set when creating the property (a default of 2 months, and max of 14 months).
There are many configuration options within explorations to help you uncover new insights and represent your data in a way that makes sense to your team. Let’s explore . . .
Funnel Exploration
Funnel Exploration is a powerful tool that helps nonprofits visualize and analyze the steps users take through specific conversion funnels, such as the donation process or newsletter sign-ups.
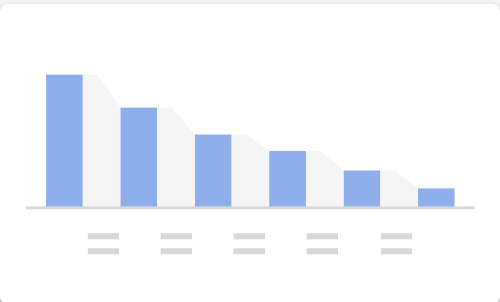
By using Funnel Exploration, digital fundraisers can gain valuable insights to optimize their campaigns, improve user experience, and increase conversion rates:
- Identify drop-off points: visualizing the user journey through the conversion funnel allows fundraisers to identify points where users drop off or abandon the donation process (or email signup process). This information can help them pinpoint areas that need improvement, such as overly complex donation forms or fuzzy calls to action.
- Optimize user experience: helps fundraisers understand how users navigate through their website or app and identify potential bottlenecks or friction points. By addressing these issues and optimizing the user experience, fundraisers can increase the likelihood of users completing the desired actions, such as making a donation or signing up for a newsletter.
- Measure campaign effectiveness: by tracking the performance of specific conversion funnels related to marketing campaigns or fundraising initiatives, nonprofit fundraisers can evaluate the success of their efforts and make data-driven decisions to optimize their strategies.
Unlike UA, funnel steps aren’t limited to page views, but can also be events like purchase.
Path Exploration
Path Exploration is an insightful tool that allows nonprofits to examine and understand the sequence of events and actions users take on their website or app.
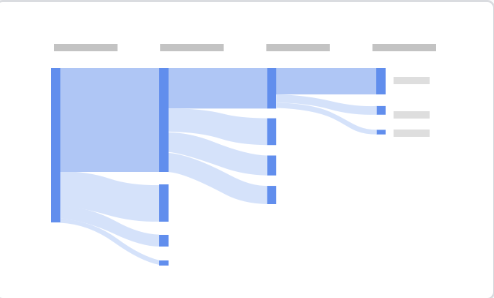
By leveraging Path Exploration, nonprofits can gain valuable insights to optimize user engagement, content, and overall fundraising strategy:
- Identify popular paths: by analyzing the most common paths users take, digital fundraisers can discover which content, pages, or features resonate the most with their audience. You can do either forward path reports (what people do from a certain starting point) or reverse path reports (drilling back from what happened before a purchase).
This information can be used to prioritize and optimize those elements to increase engagement and donations. - Optimize content strategy: helps fundraisers understand the sequence of events leading up to a conversion, such as a donation.
This information can be used to refine content strategy by creating more targeted and relevant content that guides users toward the desired action. - Segment analysis: allows fundraisers to segment paths by user properties or event parameters, offering insights into how different audience segments interact with their website or app.
This information can be used to tailor fundraising strategies and messaging to better resonate with specific donor groups, ultimately increasing user engagement and conversion rates.
Segment Overlap
Segment Overlap is a useful feature that allows nonprofits to analyze the overlap between different user segments or audiences.
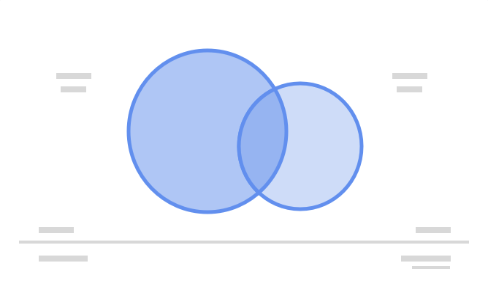
Digital fundraisers can use this exploration to gain valuable insight into their audience’s behavior, preferences, and interactions:
- Identify common traits: analyze the overlap between user segments can help digital fundraisers discover shared characteristics, behaviors, or preferences (e.g. how many donors are also petition signers?).
This information can be used to create targeted marketing campaigns or content that appeals to these shared traits, increasing user engagement and donations. - Optimize audience targeting: visualize the overlap between different audiences to help digital fundraisers refine their targeting strategy.
By focusing on unique or underrepresented segments, fundraisers can expand their reach and tap into new donor pools, ultimately increasing donations. - Personalize communication: tailor your messaging and communication to better resonate with specific segments.
By understanding the commonalities between these segments, fundraisers can create personalized content and offers that appeal to the unique needs and preferences of their donors, improving conversion rates and donor retention.
User Lifetime
The user lifetime report is especially powerful when analyzing the paid acquisition efforts of your nonprofit because it lets you create reports that visualize which source is driving users with the highest lifetime revenue — not just revenue for a selected month.
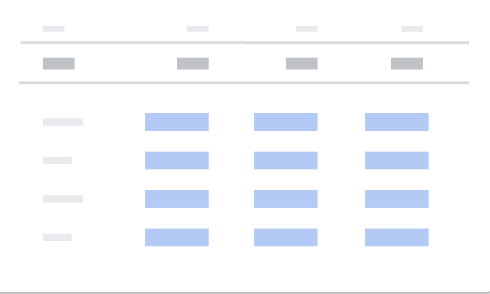
With GA4, you can uncover the fundraising campaigns that are acquiring the most valuable users, with the highest purchase probability and lowest churn probability. User Lifetime can help digital fundraisers:
- Understand donor value: assess the long-term value of their donors by analyzing the total revenue generated by individual users over time. This information can be used to identify high-value donor segments and tailor fundraising strategies accordingly, ultimately maximizing donations.
- Optimize fundraising strategies: evaluate the effectiveness of various campaigns, channels, and tactics throughout the donor journey. By identifying the strategies that yield the best long-term results, fundraisers can make data-driven decisions to optimize their efforts and maximize donor value.
- Improve donor retention: identify the factors that contribute to donor churn and develop targeted retention strategies. By addressing these factors and nurturing long-term relationships with donors, fundraisers can increase the likelihood of recurring donations and improve overall fundraising results.
As you can see, there are many powerful new ways to improve your fundraising program using these features—many of which were previously only available in the paid GA360 editions.
This overview just scratches the surface, but if you’re looking to become fully proficient check out the GA4 for Nonprofits course, which is available by activating your free 30-day NextAfter Institute Membership trial.
Get the in-depth training you need to become GA proficient
In the Google Analytics 4 for Nonprofits course, you’ll walk through how to set up Google Analytics 4, get a framework to answer your biggest analytics questions, and learn how to navigate the most relevant and helpful reports.
Activate the GA4 course now